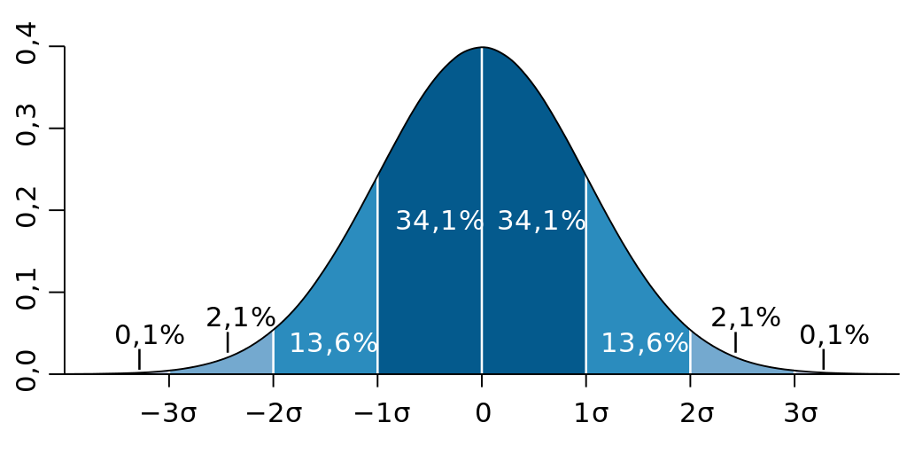
By RAFAŁ WAŚKO (Predictive Solutions) The three-sigma rule is an important tool in statistics and quality management. In the context of data analysis, it allows the identification of outlier points that are significantly different from the rest of the data. The use of...
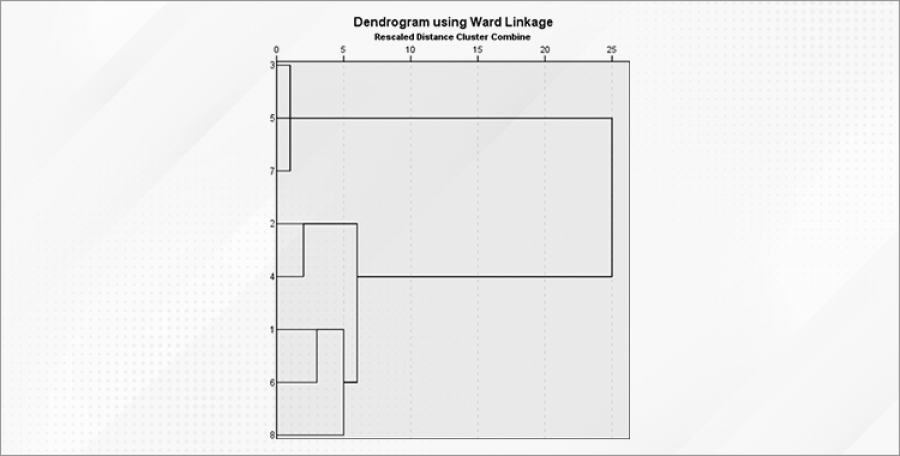
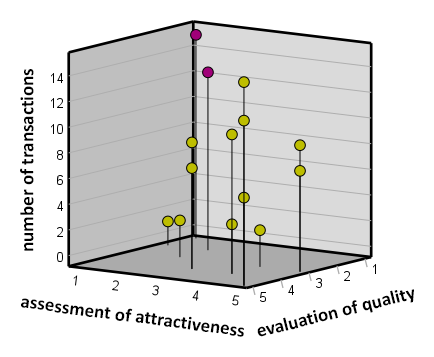
By RAFAŁ WAŚKO (Predictive Solutions) Segmentation is a key process in data analysis, dividing a data set into relatively homogeneous groups based on specific criteria. The purpose of segmentation is to identify hidden patterns, differences and similarities between...
Von NATALIA GOLONKA (Predictive Solutions) Can one abnormal occurrence cause concern? Based on one deviation from the norm, should a red light start flashing? Of course! In many industries and businesses, an anomaly is a sign that must be reacted to quickly and...
By NATALIA GOLONKA (Predictive Solutions) Entropy is a measure of disorder or uncertainty in a probability distribution.The concept was first introduced in 1854 by the physicist Rudolf Clausius, dealing with thermodynamic issues, and in this sense the definition of...
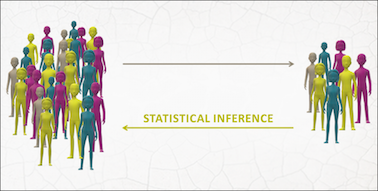
By NATALIA GOLONKA (Predictive Solutions) Statistical inference is the branch of statistics through which it becomes possible to describe, analyse and make inferences about the whole population on the basis of a sample. Studying the entire population can be a very...
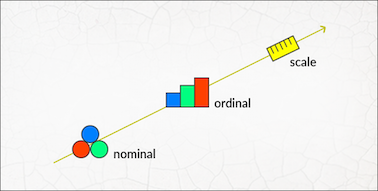
By NATALIA GOLONKA (Predictive Solutions) The level of measurement is one of the most important properties of variables. It determines which statistical tests will be available to the researcher during the course of the analysis. But what information does it convey to...