By NATALIA GOLONKA (Predictive Solutions)
The Customer Satisfaction Index (CSI) is a method used in marketing to evaluate client satisfaction derived from products or services being provided by a company or organisation.
Using a short questionnaire it is possible to bring down the CSI to a single number which then lends itself for convenient multidimensional analysis. This way, the CSI enables a number of comparisons – particularly between measurements repeating over time, but also with the results of competitors or scientific criteria.
WHAT IS CSI?
The Customer Satisfaction Index is a customer’s satisfaction measure. This index makes it possible to measure the satisfaction of customers across several attributes and touchpoints, such as:
- quality of a product/service
- completion time for the product/service
- customer service level
- comfort of purchasing
- price of the product/service
CSI can be used to compare different products or services, control the assessment of different areas of the company’s operations, track changes in customer satisfaction, and assess the significance of particular criteria.
In addition to the use of CSI by commercial enterprises, this coefficient is also used on the governmental level. The first such application of CSI was the Swedish Customer Satisfaction Barometer (SCSB), a consumer satisfaction measure developed by C. Fornell in 1989.[1] The same author, together with his team, later developed the American Customer Satisfaction Index (ACSI)[2] which, since 1994, measures on a monthly basis the satisfaction of American consumers across a range of products and services . The ACSI is derived from a survey, which in a given year, reaches approximately 350,000 households.
HOW TO CONDUCT A SURVEY USING CSI?
In order to produce a reliable CSI result, it is necessary to carry out several basic stages of the survey correctly. The first stage is the exploratory phase where the factors determining customer satisfaction from a product or service are identified. Once satisfaction criteria have been determined, weights can then be assigned to each of them based on their significance. These activities require expert knowledge drawn from previous experience, additional methods such as surveys, interviews with consumers, brainstorming, or other heuristic methods within one’s own team.
Depending on the product or service in question, the same criteria may have a totally different significance level. For example, when creating a list of features being examined for furniture and for seasonal decorations, quality and durability are key attributes for furniture, whereas for seasonal decorations, adequacy for the occasion, originality, and current trends are the most significant purchasing criteria.
The next stage is conducting a questionnaire among customers. A respondent is asked to evaluate their satisfaction from each of the stated criteria. The study may use the scale of 0-10, or the Likert scale e.g. 1-5, or 1-7. The lowest values mean total dissatisfaction with the given attribute of the product or service, and the highest values mean complete satisfaction. Additionally, questions about the importance of the given attribute are useful for deriving significance coefficients which then allow for the aforementioned weights to be assigned.
From a consumer’s perspective, a CSI survey has to be in a brief and accessible form containing as many questions as the criteria of interest. If we know that our group of customers are generally unwilling participants in marketing studies, shorter, simpler answer scales may be used (e.g. 1-5), the number of the criteria surveyed may be capped, or the questions may be restricted only to evaluating satisfaction, with no significance questions.
HOW TO CALCULATE AND INTERPRET THE CSI FACTOR?
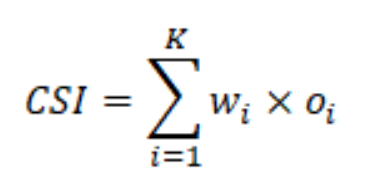
After collecting the quantitative data, the CSI factor is calculated using the following formula:

When interpreting the results received, criteria developed in available literature may be used, e.g. Wolniak, Skotnicka-Zasadzień, 2008[3], which states:
- 0‒40%: Very bad – client extremely dissatisfied
- 40‒60%: Bad ‒ customer dissatisfied
- 60‒75%: Average ‒ there are certain issues in the scope of customer satisfaction
- 75‒90%: Good ‒ there are few issues with customer satisfaction
- 90‒100%: Very good ‒ customer satisfied to a high level
A frequent and important application of CSI is comparing the results over time. This makes it possible to monitor the customer satisfaction level both at the general level, and for particular attributes surveyed.
When comparing CSIs, a convenient solution is to present the comparison in percentage form as this allows for easier interpretation and remains independent from weights assigned to them. If these criteria are based on the answers of consumers, one has to remember that the structure and importance of the attributes being analyzed may change in subsequent measurements. If the exact same survey is utilized each time, the calculation may be limited to the basic CSI formula presented above.
When the resources for a marketing study are limited, a simpler CSI formula may be used, without the application of the significance coefficients (weights) which we will look at later. Here, it is enough to divide the sum of answers by the number of the criteria surveyed:

CSI in Practice
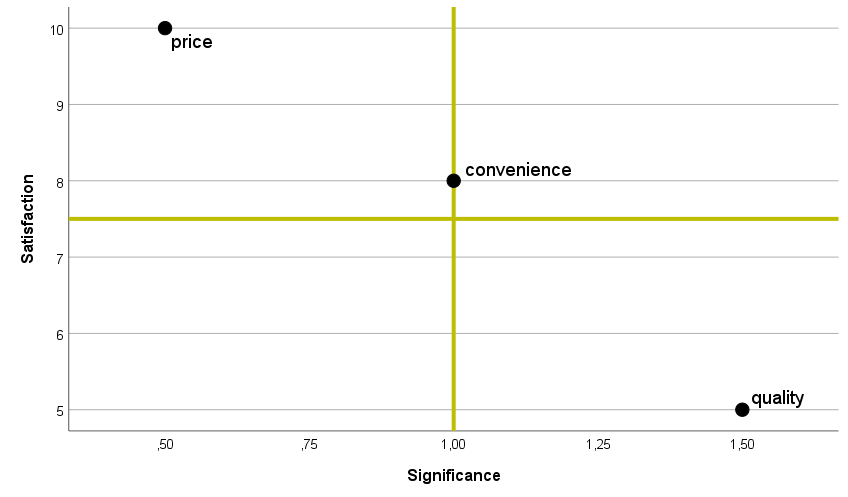
Let’s assume that we study customer satisfaction of a product across three attributes: price, quality, and convenience, using a scale of 1-10. The customers evaluated the price of the product as 10, the quality as 5, and the convenience as 8.
Using the simplest approach, the CSI result will be

or in percentage form:


QUALITY MAP IN CSI

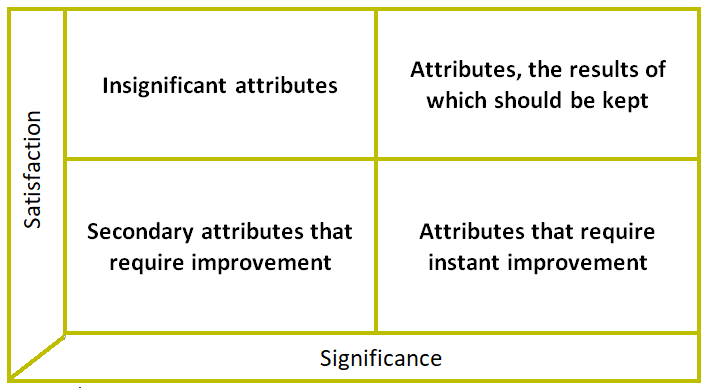
Fig. 1 Quality Map areas
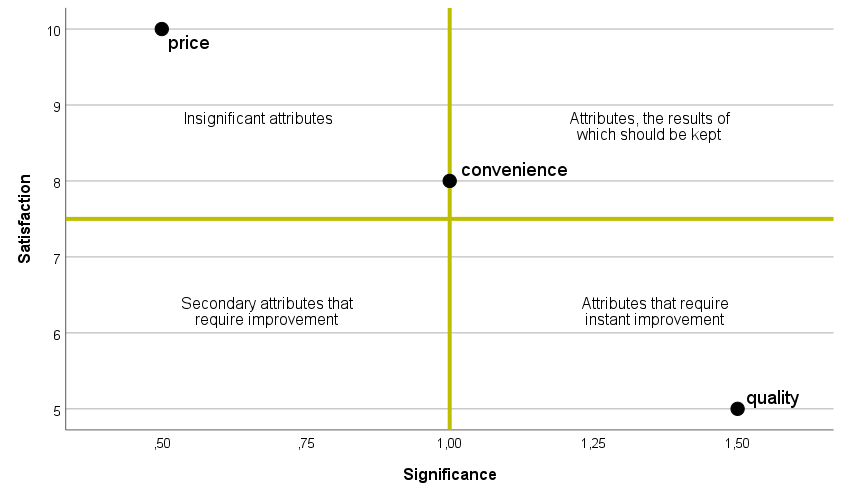
The interpretation of the Customer Satisfaction Index may be aided by a Quality Map (Fig. 1). Using a scatter plot, the product attributes are mapped based on the average values of the criteria significance and customer satisfaction. The top-left quadrant includes insignificant attributes, i.e., criteria that are not significant to the customer but are evaluated positively. The top-right quadrant, which includes attributes that are evaluated well and are deemed to be significant, is the area where high results must be maintained. In the case of low customer satisfaction, we can divide the criteria into two areas: the bottom-right quadrant is high priority, where product attributes are significant to the customer and must be improved as soon as possible; the bottom-left quadrant contains secondary attributes which may be improved later.

Fig. 2 Quality Map example

Fig. 3. Quality map with breakdown into the importance of product attributes
SUMMARY
The Customer Satisfaction Index is a measure of a customer’s satisfaction, often and commonly used in marketing studies. When compared to other methods, such as, NPS, CSAT, or CES, the CSI method makes it possible to obtain more detailed, multidimensional results, and thus to better understand the evaluations and motivations of consumers, and to diagnose specific areas which require improvements.
With all its complexity, CSI remains a universal indicator which works both for commercial enterprises and for government. Since it can be represented by a single value, the CSI enables a number of comparisons, namely between own products, a competitor’s products, or between measurements repeated over time.
[1] Fornell, C. (1992). A national customer satisfaction barometer: The Swedish experience. Journal of marketing, 56(1), 6-21.
[2] Fornell, C., Johnson, M. D., Anderson, E. W., Cha, J., & Bryant, B. E. (1996). The American customer satisfaction index: nature, purpose, and findings. Journal of marketing, 60(4), 7-18.
[3] Wolniak, R., & Skotnicka, B. (2008). Wybrane metody badania satysfakcji klienta i oceny dostawców w organizacjach. Wydawnictwo Politechniki Śląskiej.

