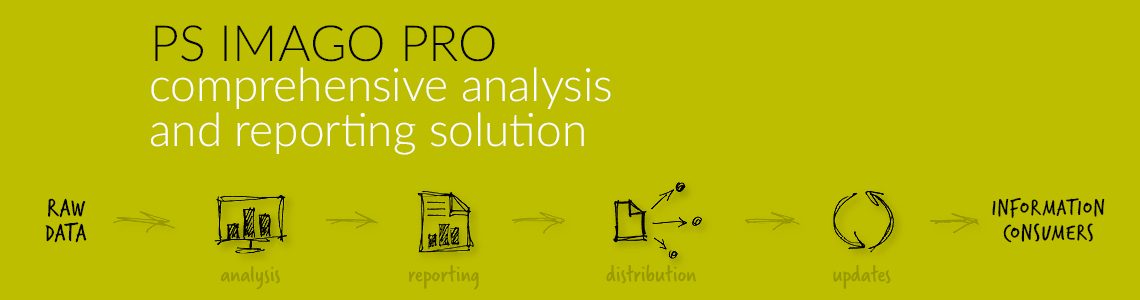
PS IMAGO PRO
Graphs and Tables
Especially in the area of charting and graphics, users repeatedly reach the system limits when using SPSS Statistics exclusively. With PS IMAGO PRO, we are therefore expanding the functional scope of SPSS Statistics with essential new charts.
Until now, updating a report meant creating and exporting result objects in IBM SPSS Statistics from scratch. Now the new feature can fully automate the process of updating and publishing ad-hoc and periodic (e.g. quarterly) reports.
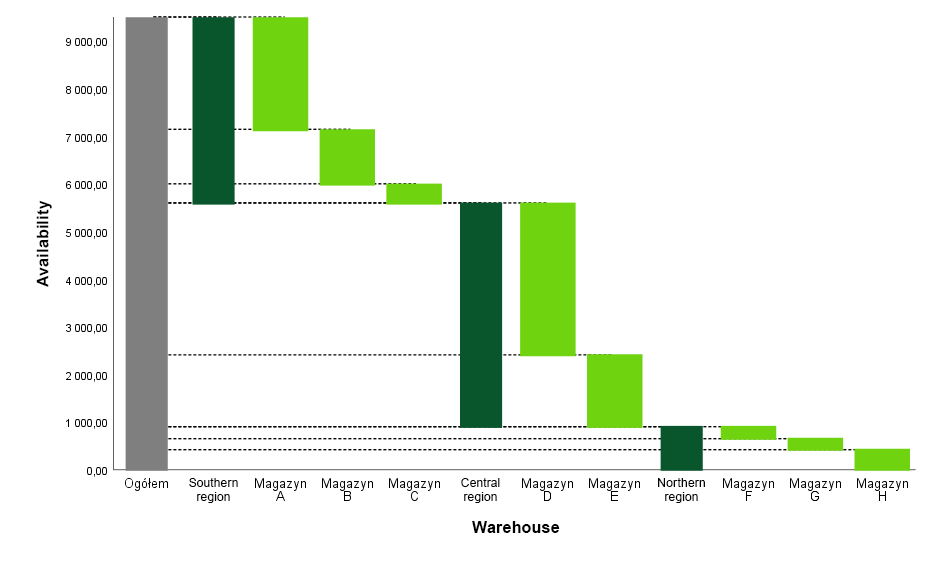
Waterfall graph
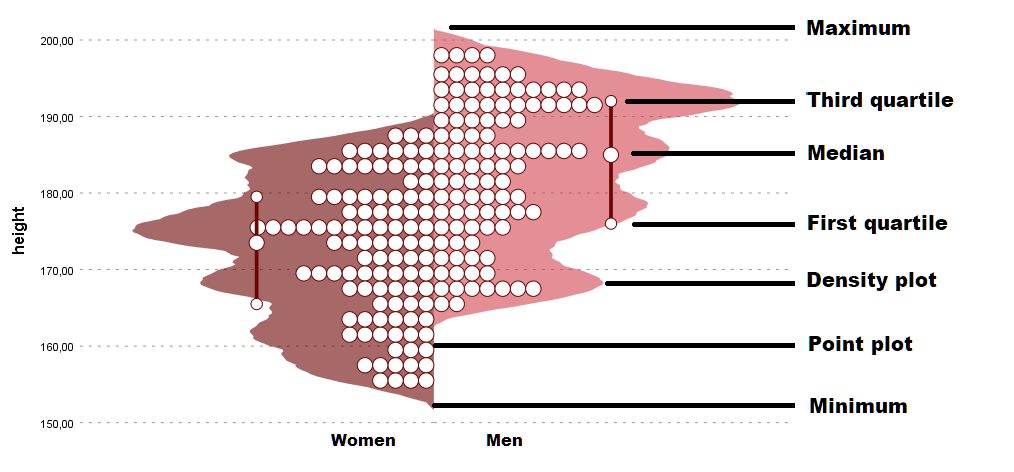
Violin plot
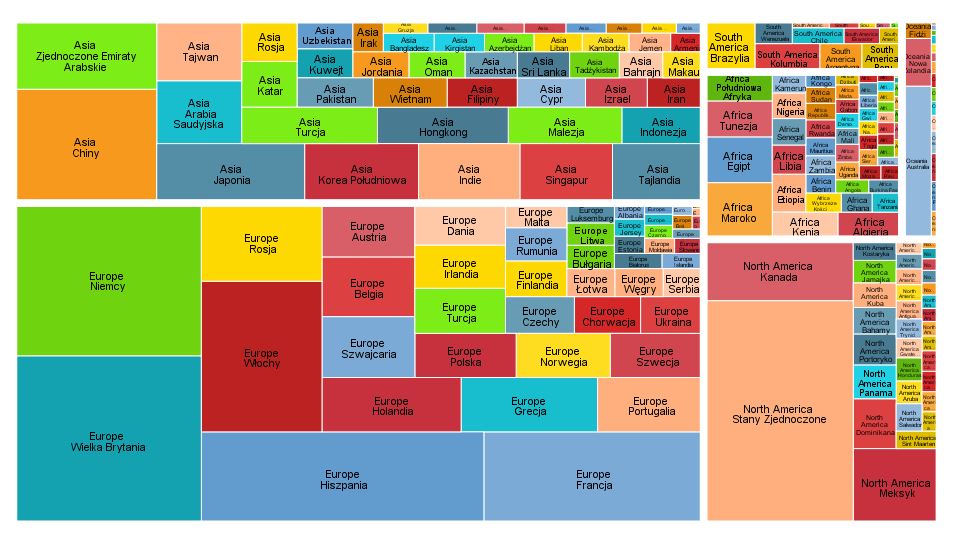
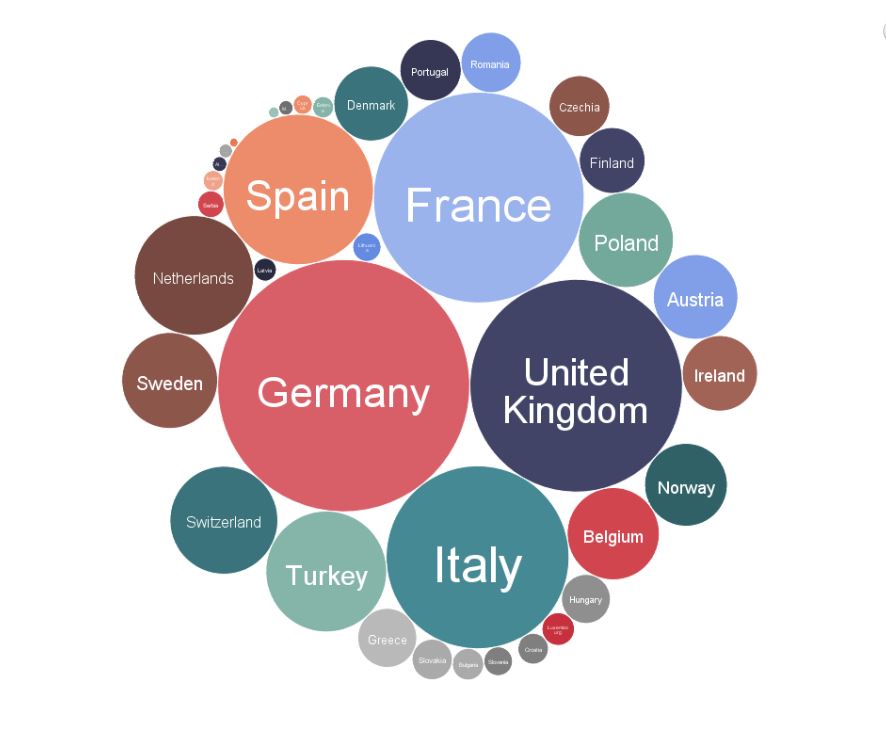
Treemap
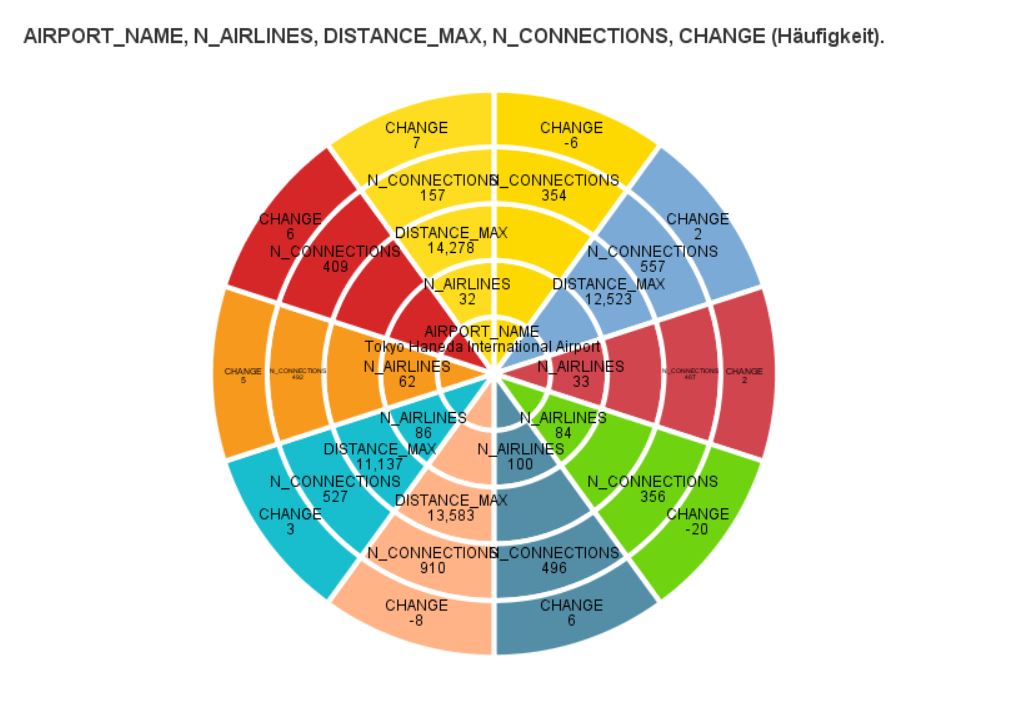
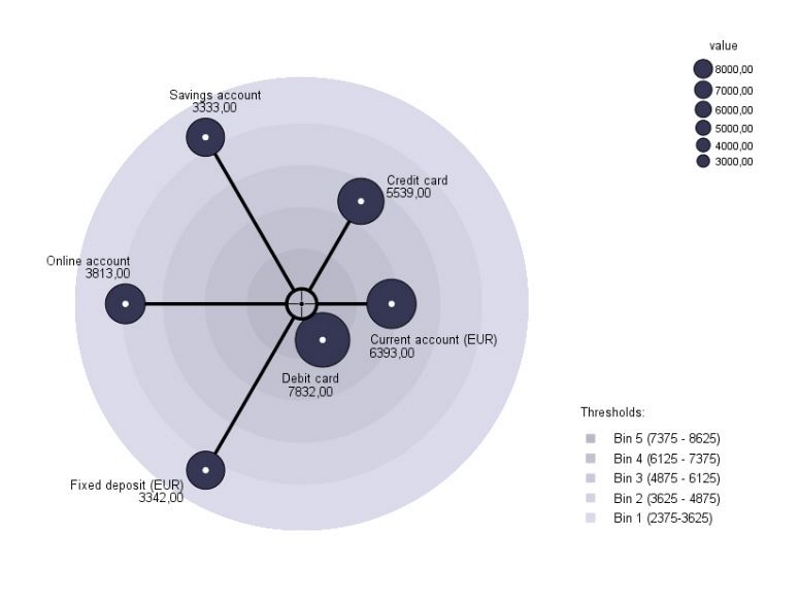
Ring Chart
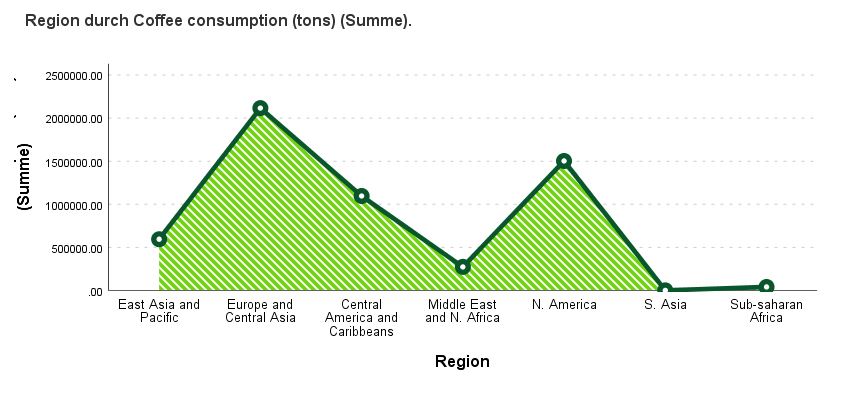
Series graph
Word Cloud
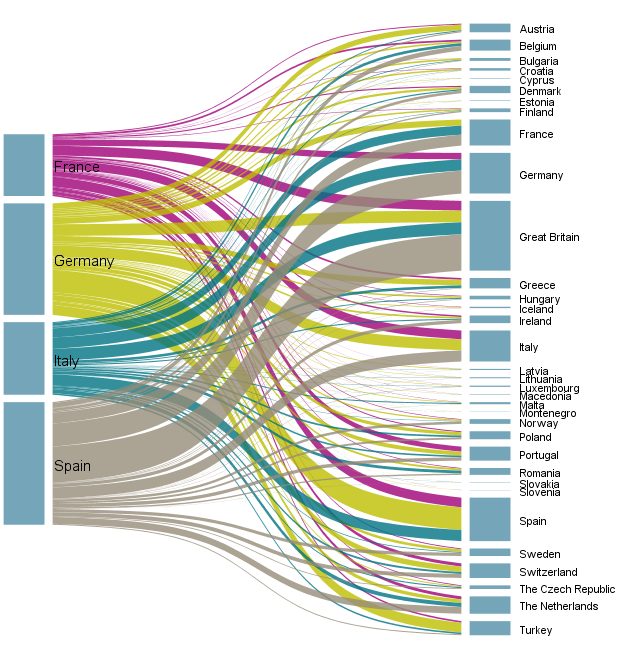
Sankey Diagram
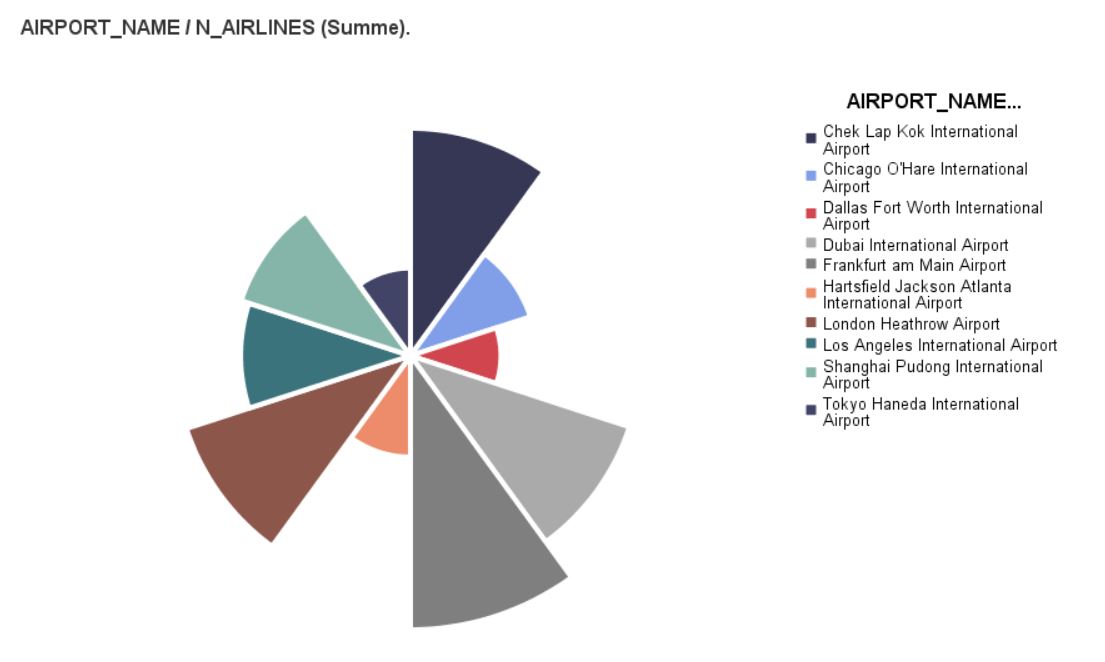
Nightingale Rose
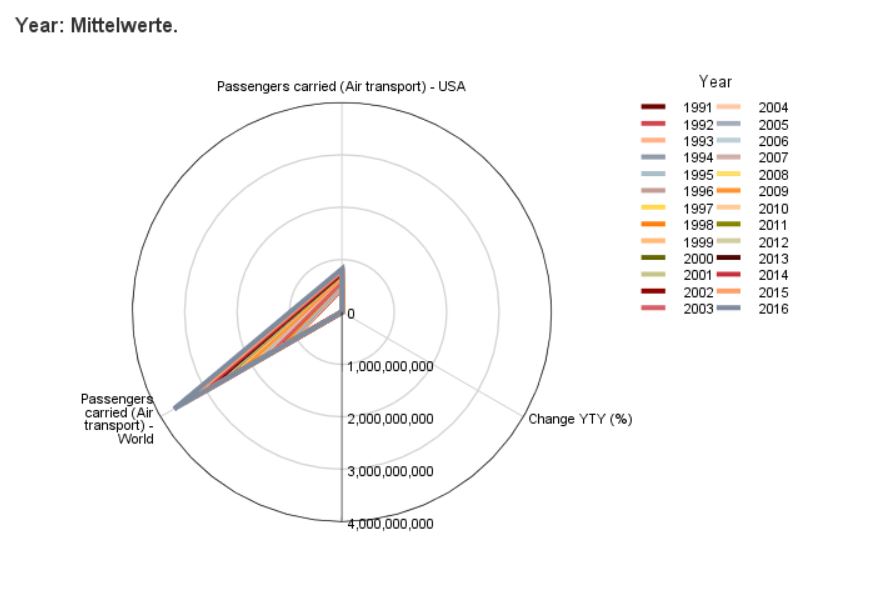
Radar Chart
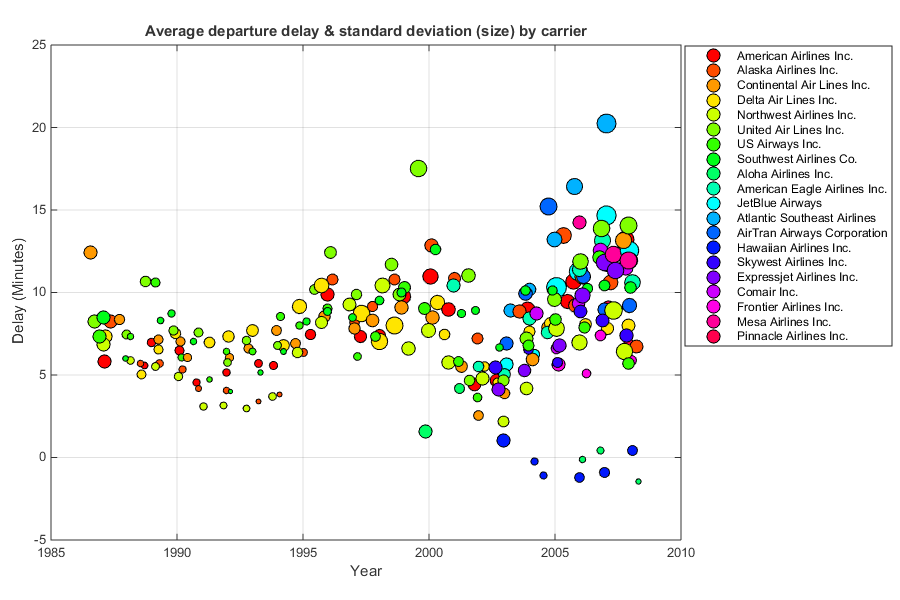
Multidimensional Scatterplot
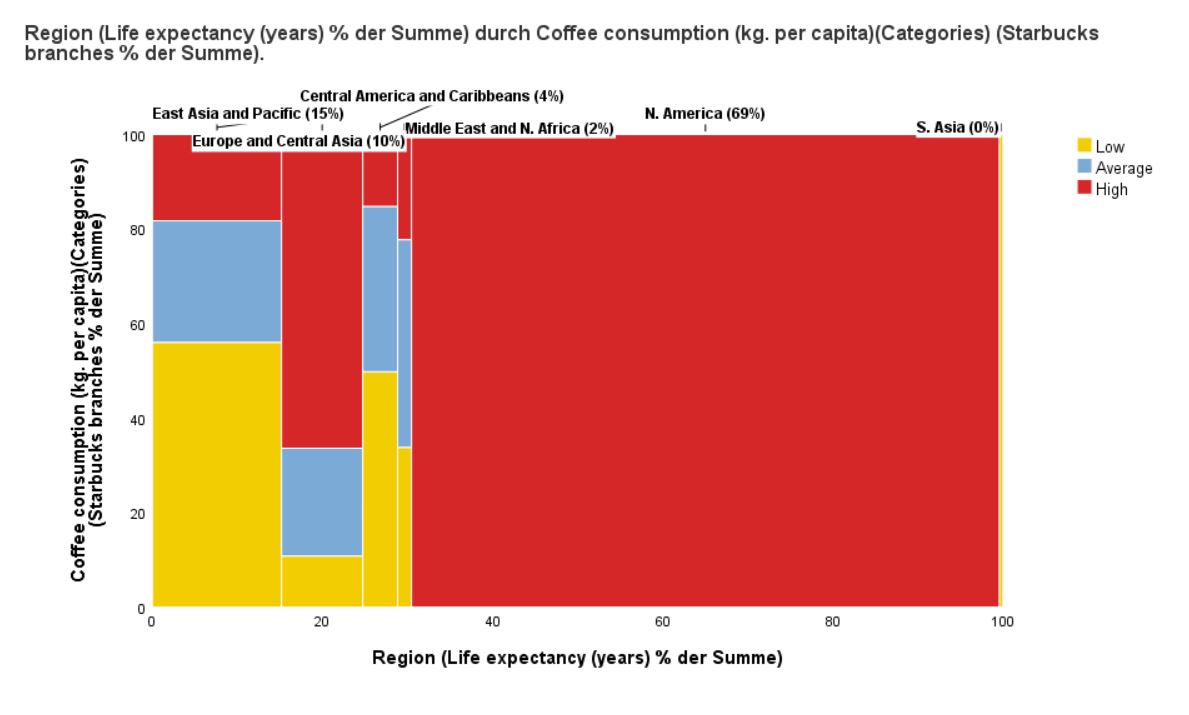
Marimekko Chart
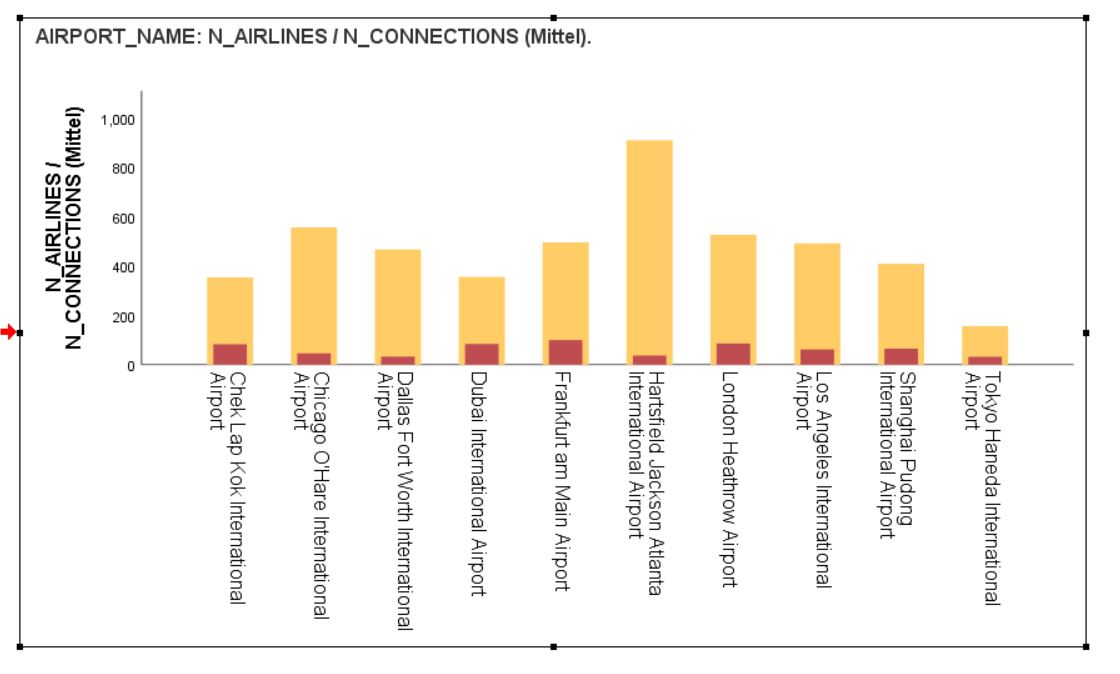
Layered Bar Chart
Hierarchical graph
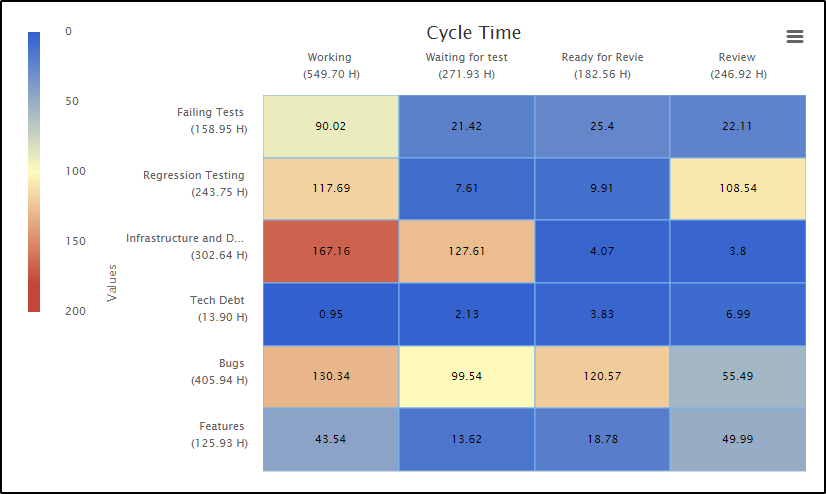
Heatmatrix Bars
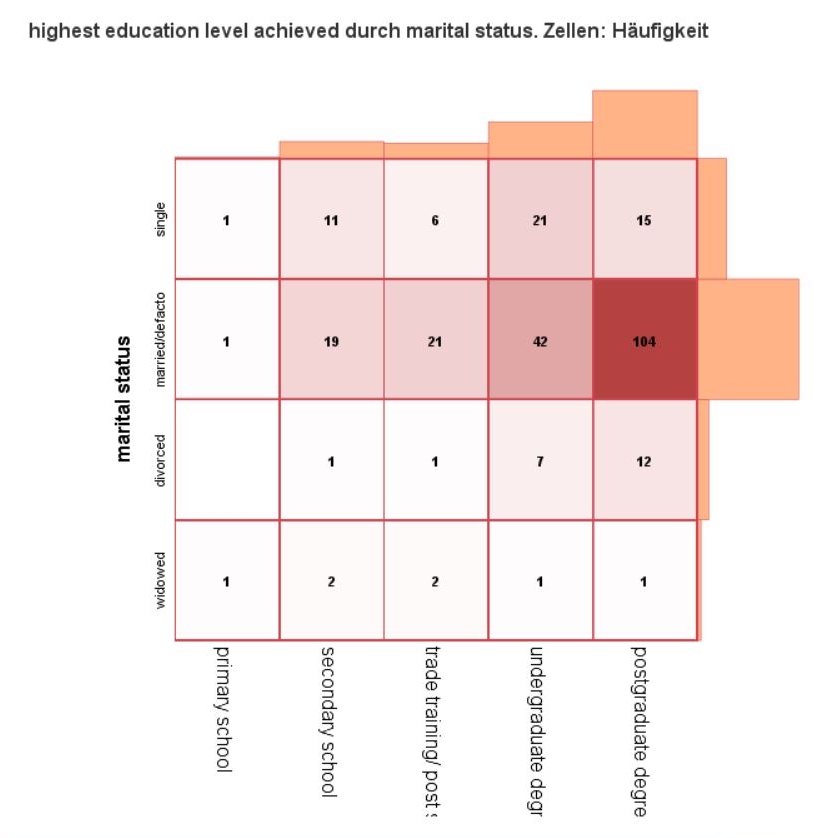
Contingency Map
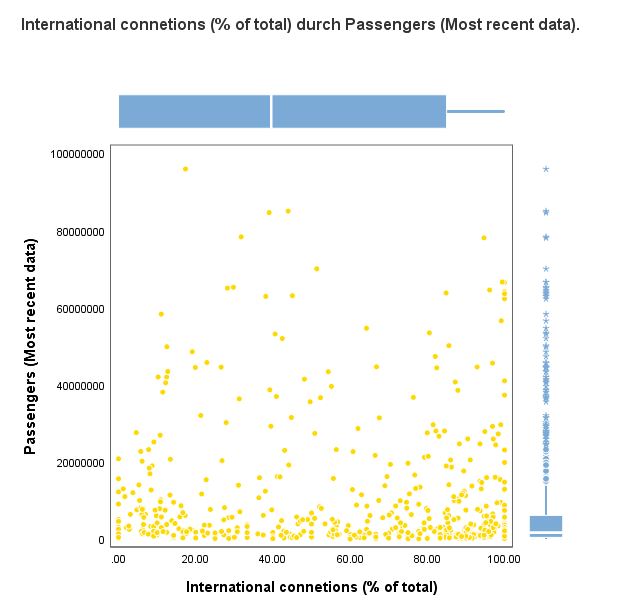
Scatterplot and Distribution Graph
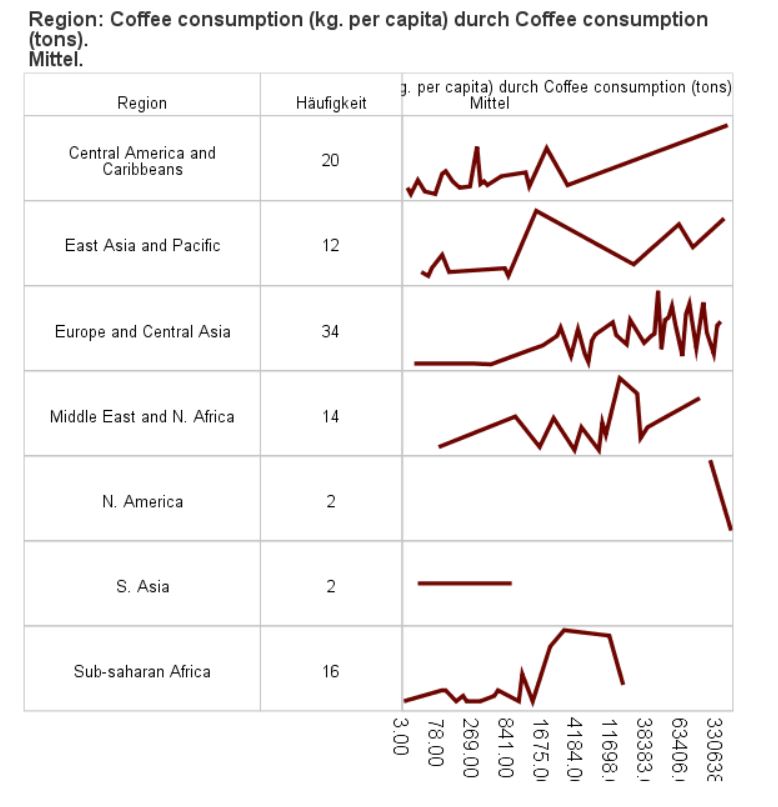
Table: Series
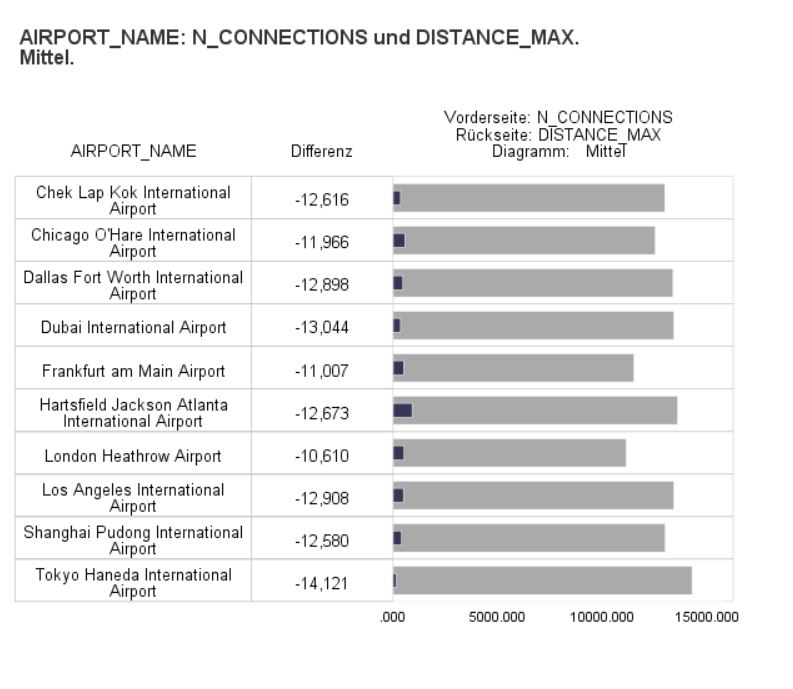
Table: Layered
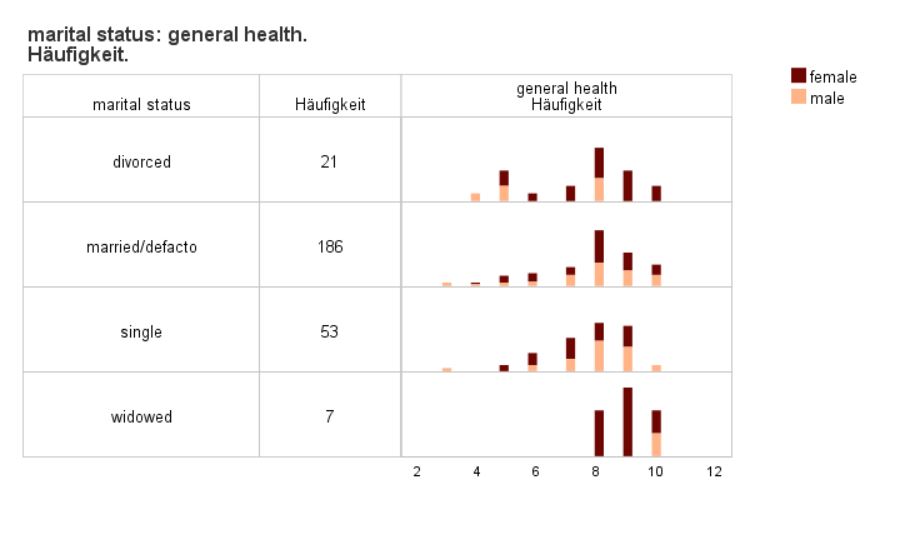
Table: Histogram
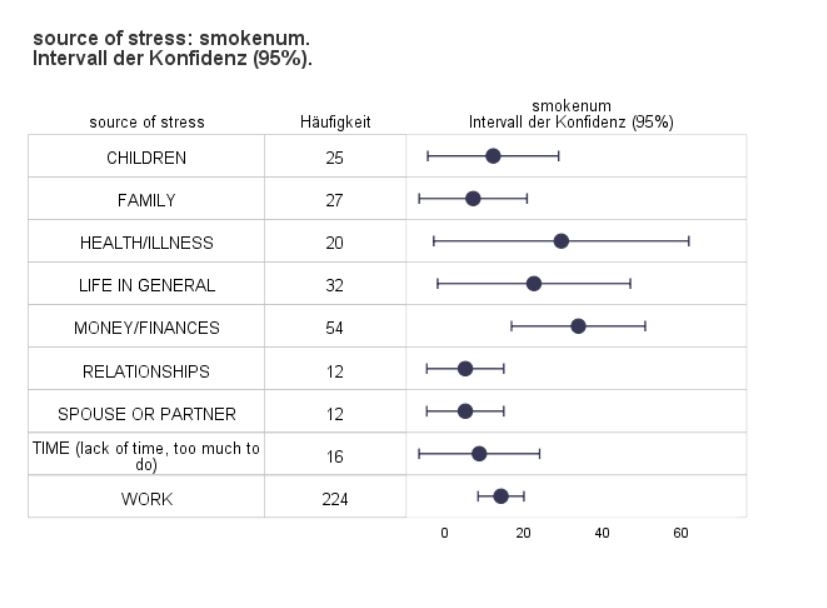
Table: Error Bars
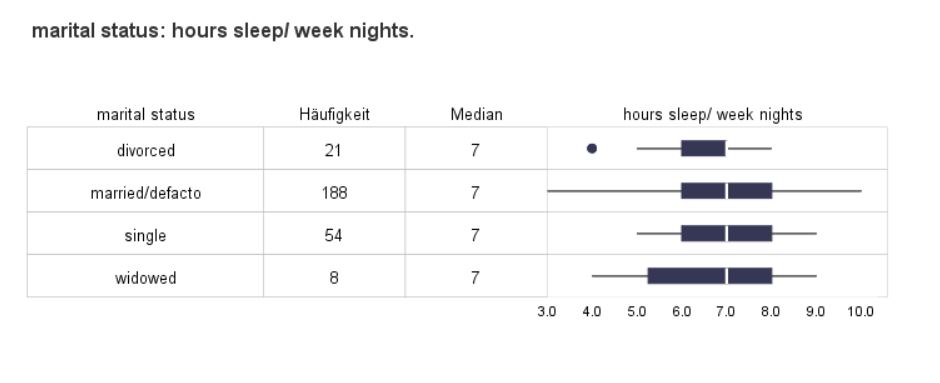
Table: Boxplot
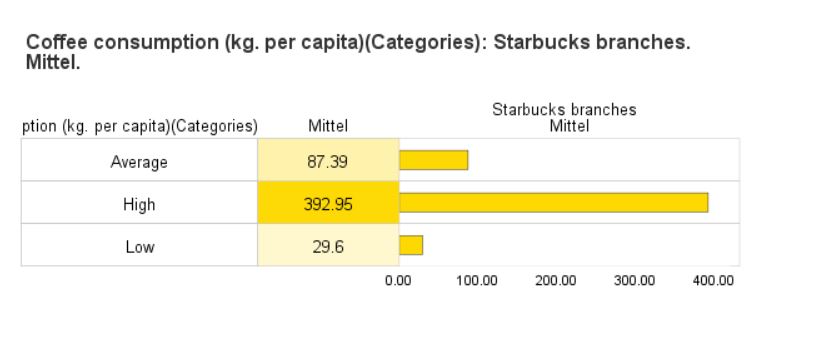
Table: Bar
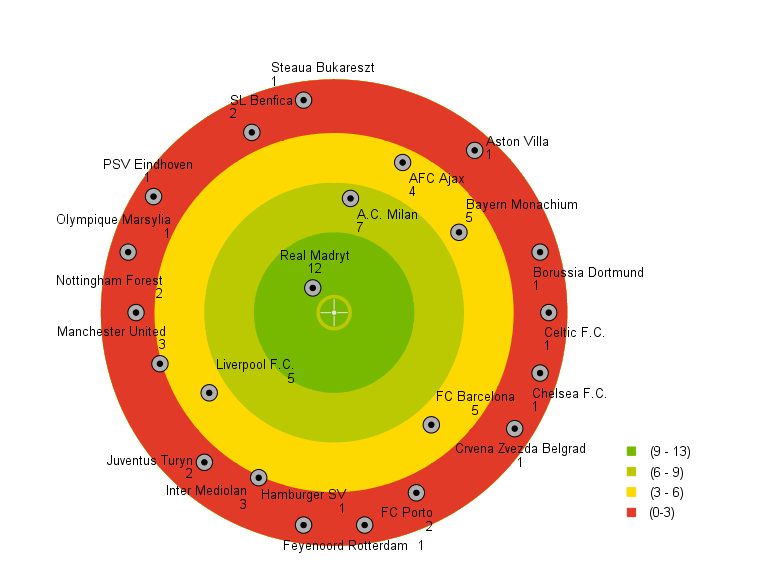
Dashboard: Dartboard

Dashboard: Arrows & Traffic Lights