By M.GIERCZAK and P. BUDZEWSKI (Predictive Solutions)
A COMPLEX KNOWLEDGE MANAGEMENT SYSTEM REQUIRES INTEGRATION, NAMELY THE INTEGRATION OF MULTIPLE AND DIVERSE PROCESSES, AND THE INTEGRATION OF THE TOOLS RESPONSIBLE FOR THOSE PROCESSES. IN PRACTICE, HOW CAN WE CREATE A COMPLETE ANALYTICAL SYSTEM THAT NOT ONLY TAKES ADVANTAGE OF MODERN ALGORITHMS, BUT ALSO OFFERS THE BUSINESS INSIGHTS DEMANDED BY DECISION-MAKERS?
BUSINESS INTELLIGENCE AND DATA SCIENCE
For the purposes of this article, we will distinguish between two branches of business data analysis: Business Intelligence and Data Science. The former enables observation of the current state of the business, e.g., volume of sales, manufacturing output, productivity, so as to allow the understanding of the company’s performance, both past and present. The latter uses knowledge from various disciplines, e.g., statistics, machine learning, mathematics, to identify patterns or trends using historical data, which allow us to make predictions of the future.
The user generally encounters Business Intelligence in the form of various reports, visualizations, and dashboards. Data Science, on the other hand, typically takes the form of models that are “baked in” to processes allowing for autonomous or semi-autonomous decisions based on predicted outcomes.
PS IMAGO PRO AND PS CLEMENTINE PRO
Among the tools available from Predictive Solutions, PS IMAGO PRO sits in the Business Intelligence camp, and PS CLEMENTINE PRO in the Data Science camp. The latter allows complex management of any analytical processes, lending itself to the effective management of processes from both domains. The tools themselves are mutually complementary at various stages of the data analysis and decision actioning process, so why not integrate both environments?
There are many potential benefits to doing this, both for the Business Intelligence and Data Science systems. For example, business decisions made on the basis of a BI system can be enhanced with sales forecasts and risk estimations – both products of Data Science. This in turn will make it easier to decide about production volumes in subsequent months, loan applications, and so-on.
Conversely, machine learning models can be less troublesome to maintain when regular assessments of their quality are readily available in the form of visualizations and dashboards – products of a BI system. Creating a transparent dashboard that monitors key model evaluation indicators will not only speed up this process, but also make the handling of this task more accessible. These are just two of many potential applications of Business Intelligence and Data Science systems integration.
JOINING FORCES: PS CLEMENTINE PRO AND PS IMAGO PRO
In recent entries about the functionalities of PS CLEMENTINE PRO, we have addressed epidemiological data on the COVID-19 pandemic. We will return to this area here. For this, we assume the role of an employee of a company manufacturing personal protective equipment. We are responsible for the analytical system that determines current and future sales volumes. Our goal is to develop a procedure that will generate a daily sales report of one of our products, and will also allow us to produce a sales forecast. To prepare the report, it will be necessary to integrate functionalities of PS IMAGO PRO and PS CLEMENTINE PRO.
The sequence of steps (and PS tool required) to complete this process can be summarized as follows:
- Gathering and integration of necessary data, i.e., sales, epidemiological, etc. (PS CLEMENTINE PRO)
- Data preparation, modeling and sales volume prediction (PS CLEMENTINE PRO)
- Data preparation for reporting (PS CLEMENTINE PRO or PS IMAGO PRO)
- Generation of relevant visualizations and report update (PS IMAGO PRO)
The management of the various stages, i.e., the triggering of respective processes in time, will be the responsibility of PS CLEMENTINE PRO Manager. We have recently written about how to automate such processes here [link to blog]. For today’s post, we explore stages 3 and 4 and their integration using PS CLEMENTINE PRO, the assumption being that stages 1 and 2 have already been completed.
DATA PREPARATION FOR REPORTING
A possible approach is the creation of a database table that gathers together all the data necessary to generate the particular report. Data in the table would be updated daily using a PS CLEMENTINE PRO task. Subsequent actions are then on the side of PS IMAGO PRO. The data should be properly filtered and selected using SQL code and downloaded to this environment (Fig. 1). In order to connect to the database, the Data Access Pack should be installed and the ODBC connection configured as necessary.

Figure 1. Sample PS IMAGO PRO syntax to enable data collection from the database
GENERATION OF RELEVANT VISUALIZATIONS AND REPORT UPDATE
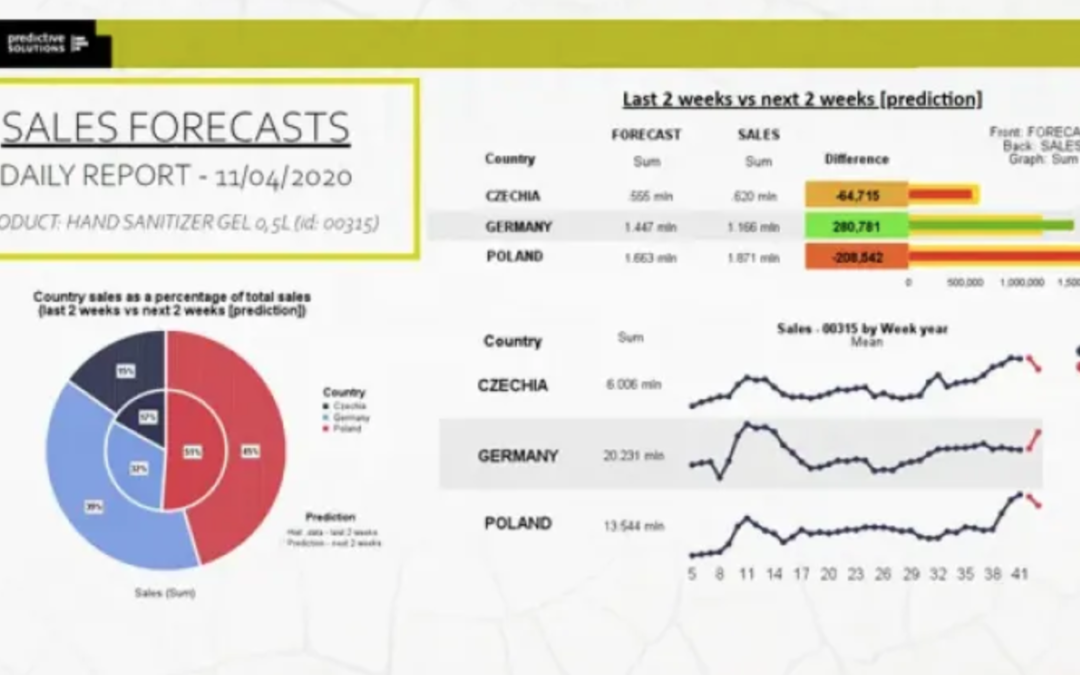
We broadly discussed the generation of visualizations and reports in PS IMAGO PRO in previous blogs (go to [link to blog site], and filter by charts, data visualization, reporting, dashboards, or PS IMAGO PRO). Storage and distribution of reports and dashboards is made possible by PS IMAGO Portal resulting in our final report (Fig. 2).

Figure 2. A sample sales forecasts report page in PS IMAGO Portal
INTEGRATION OF PS IMAGO PRO AND PS CLEMENTINE PRO PROCESSES
In order to integrate processes in both tools, it will be necessary to create a task in the PS IMAGO PRO Automation module (Fig. 3), which will connect the previously prepared stages into one whole.

Figure 3. PS IMAGO PRO menu window in PS Desktop

Figure 4. Task configuration window in PS IMAGO Process

Figure 5. Windows Task Scheduler

Figure 6. The Actions tab of a sample task in Windows Task Scheduler

Figure 7. The content of the batch file launching the PS IMAGO PRO task

Figure 8. The IBM SPSS Modeler stream script triggering the batch file

Figure 9. Sample content of the folder containing PS IMAGO PRO process activating tasks

Figure 10. Sales management dashboard
