By RAFAŁ WAŚKO (Predictive Solutions)
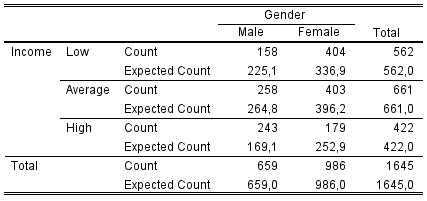
The chi-square test of independence is one of the most popular statistical tests. It is used to check whether there is a statistically significant relationship between two qualitative variables. It is based on comparing the observed numbers, i.e. those obtained in the study, with the expected numbers, i.e. those assumed by the test, if there was no relationship between the variables. If the difference between the observed and expected numbers is large (statistically significant), it can be concluded that there is a relationship between one variable and the other. This test is very popular in survey research where qualitative variables predominate. In marketing research, the chi-square test can be used, for example, to determine whether there is a relationship between the choice of the type of product packaging and the gender of the customer. Another example application may be the verification of whether the type of sport practiced depends on the education of the surveyed people. Now let’s consider an example. Suppose an analyst wants to see if the Respondent’s Income variable is statistically significantly related to the Gender variable. The chi-square test of independence assumes that the Income and Gender variables are independent of each other, i.e. the proportions are the same for all columns, and any discrepancies are due to random variation. The test compares the observed numbers with the expected numbers that would be expected if the two variables were unrelated.
Table 1.
Crosstab of gender and income
with observed and expected numbers

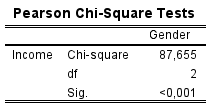
Table 2.
Chi-square test result
WHEN TO USE THE CHI-SQUARE TEST OF INDEPENDENCE?
As previously indicated, this test is used to determine whether there is a statistically significant relationship between two categorical variables. Each of the variables may have several response categories, e.g., gender – female and male; education – primary, secondary, higher, etc. Its use should be approached with caution in a situation where we have variables with a large number of categories, in which case the assumptions for the test may not be met.
ASSUMPTIONS FOR THE CHI-SQUARE TEST OF INDEPENDENCE
The chi-square test has only a few assumptions, and the simplicity of its implementation and interpretation makes it a popular choice in data analysis.
The most important assumptions of the chi-square test:
- Variables in the analysis must be categorical (nominal or ordinal).
- The sample from which the results come was randomly selected from the population.
- Independence of the studied categories (an observation cannot belong to two categories of one variable at the same time).
- No more than 20% of the cells have an expected count of less than 5.
- Minimum expected count is greater than 1.
CHI-SQUARE TEST OF INDEPENDENCE FORMULA
Although currently calculating the chi-square test “on the hoof” is an activity that is rather only performed by students in statistics exams, it is worth looking at the formula for this statistic.
Where:
X² – chi-square test,
Oij – the count observed in the cell formed by the category i of the row variable and the category j of the column variable,
Eij – expected count in the cell created by category i of the row variable and category j of the column variable,
∑ – sum of results (squares of standardized residuals) calculated for all table cells o in rows and k columns, of which there are * k.
As you can see, the chi-square statistic is the square of the difference between the observed and expected numbers, divided by the expected number. The obtained results are then summed up for all groups.
The null and alternative hypothesis for the chi-square test of independence can be written as follows:
- H0: The analyzed variables are independent.
- H1: The analyzed variables are dependent.
To sum up… The chi-square test of independence is a popular statistical test used in research where we ask research questions about whether one of the variables is dependent on another. The condition for its use is that the variables must be qualitative variables. Most often, such variables are collected in the case of social, marketing and psychological research.

