PS IMAGO Pack PRO
and IBM SPSS Statistics
PS IMAGO Pro includes SPSS Statistics!
It is a proven and leading tool for quantitative data analysis. A set of modules provides numerous techniques for tasks such as descriptive analysis, forecasting and prediction, and classification and grouping.
41 additional techniques of PS IMAGO Pack PRO significantly extend the functionality of IBM SPSS Statistics. They provide methods for data set management, variable transformation, and variable dependency analysis that were not available until today. In addition to the new techniques, PS IMAGO Pack PRO offers a number of novel methods for visualizing results, e.g. dashboards or side-by-side charts.

Data management
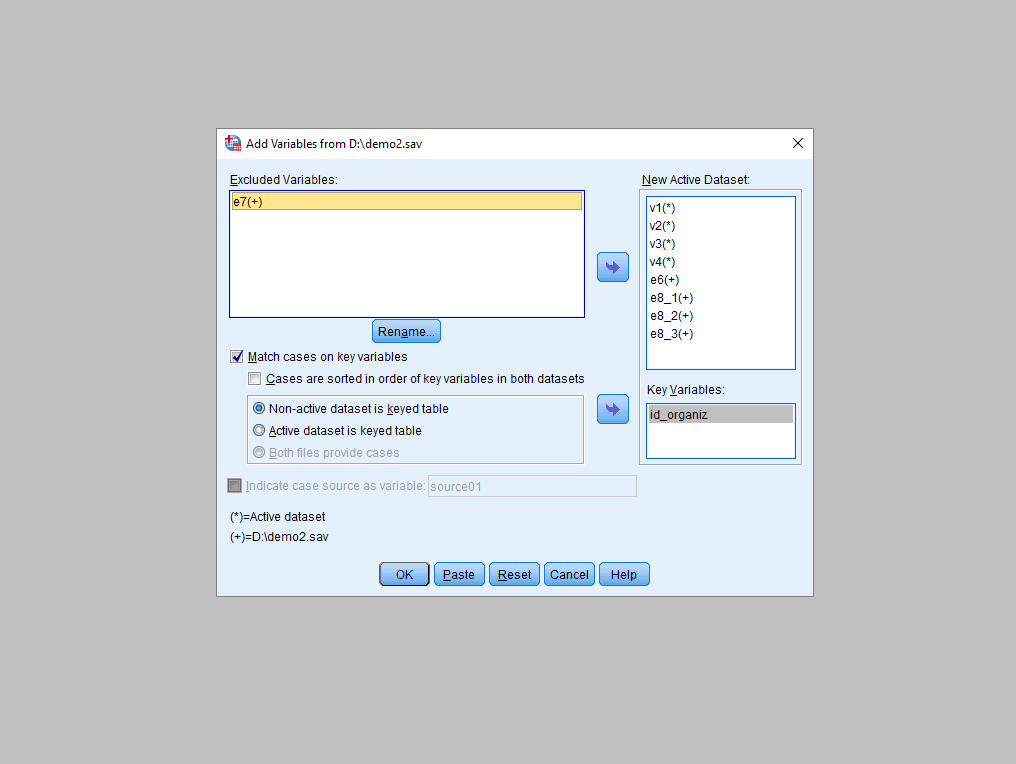
The application provides convenient access to data from various sources thanks to its creators for importing data from spreadsheets such as Excel, text files or databases such as Oracle, MS SQL Server and DB2. It can merge data sets by adding observations or variables. Observations from two files can be correctly matched with variables that serve as merging keys. You can use commands to merge up to 50 records at once. You can also change the organization of the data in a set or the level of aggregation of the data. Available aggregation functions include summary statistics (average, median, sum, standard deviation) and specific values (the first and last value, minimum, maximum). The application can define and store metadata, which are properties of variables displayed in dialog boxes and used to describe result objects. You can also assign attributes to variables and define the absence of user data.

Data preparation
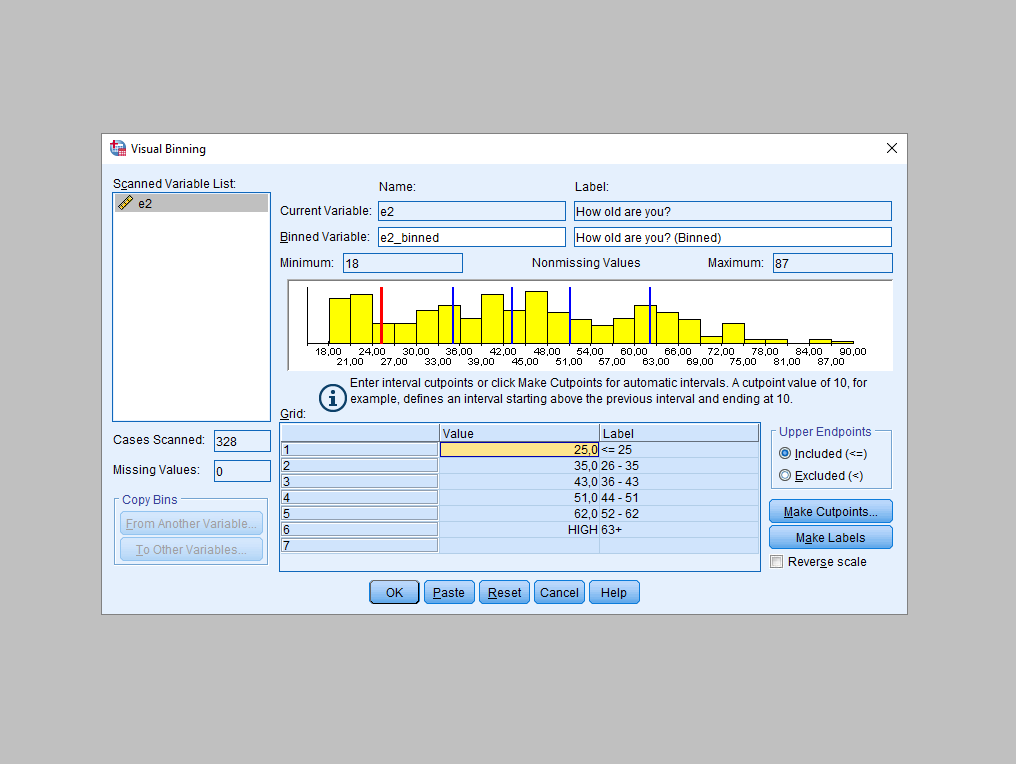
PS IMAGO PRO provides a variety of tools that are critical for preparing data prior to analysis: Data cleaning, to clean databases and manage data gaps; Data quality assessment, to identify incorrect values, duplicates and atypical observations or “anomalies”; Data exclusion techniques, to properly handle observations that contain too many data gaps or replace them with different methods; Data transformation techniques, which allow the categorization, standardization, and calculation of new variables using algebraic transformations, logical operators, global values, and various other functions; special techniques for handling multiple response data, which allow the creation of multiple response sets that are easier to analyze.

Data Analysis
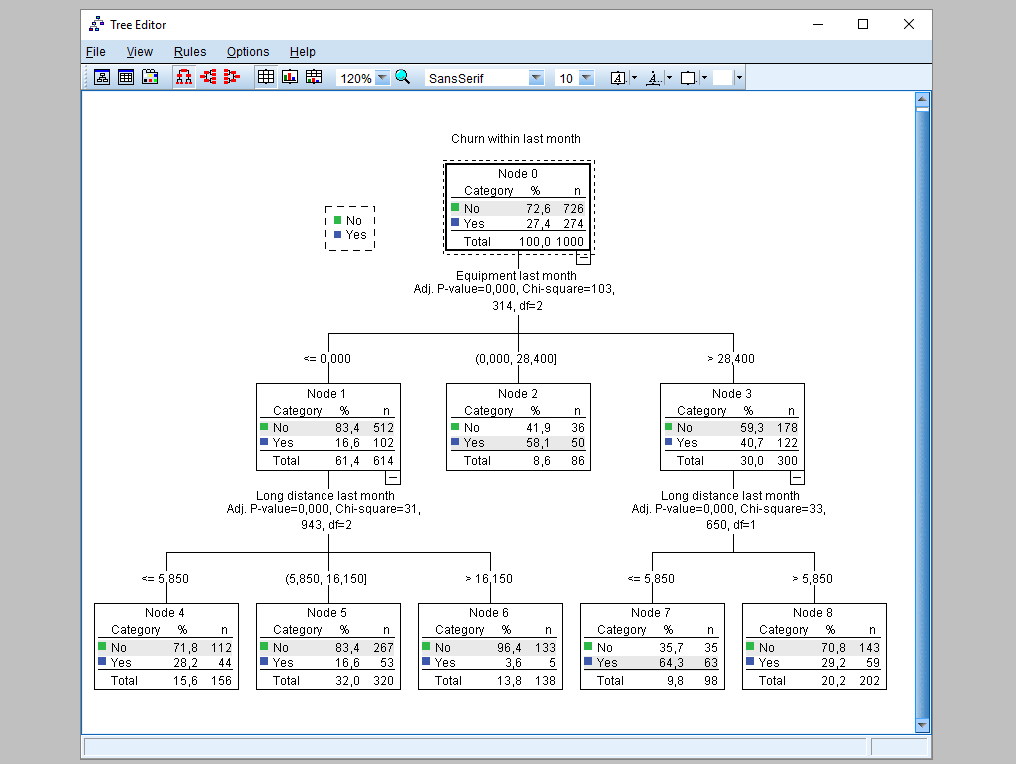
PS IMAGO PRO offers a wide range of tools and techniques for quantitative data analysis: Basic statistics for plotting frequency distributions or calculating descriptive statistics; statistical tests – both parametric and nonparametric – for analyzing dependencies between variables; a wide range of multidimensional data analysis techniques; predictive analyses, such as regression and time series forecasting; data reduction techniques for grouping similar observations and identifying correlation patterns in a group of variables and displaying them graphically in a perceptual map useful for product positioning.

Data presentation and visualization
PS IMAGO PRO has a wide range of techniques to present data in the form of tables or visualize data in the form of charts and maps. In tabular reports, the user has full control over the display of the content of cells, the dimensions of the table and its structure. Data visualization is achieved through graphical forms such as: Bar charts, pie charts, box charts, linear charts, layer plots, histograms, scatter plots, max/minute charts and many others. In addition, non-standard visualizations are also available, such as contingency charts, Marimekko charts, table charts and dashboard visualizations. Data can also be displayed in a geospatial context by dividing maps into regions or other user-defined areas. Each graph can be edited and changes saved as a template for later use. Finally, a central portal provides a convenient way to manage all analysis results.
