Written by Przemyslaw Solecki (Predictive Solutions)
Frequency, group structure, or percentage share analysis is one of the first tasks of an analyst.
The most basic form of statistical description is the table (useful in particular for analysing qualitative variables), which contains both counts and aggregated statistics (shares, sums, averages, etc.). Still, it is a rather unattractive form of result visualisation. This is why we often use plots to present results. This form of variable distribution presentation is much clearer and helps quickly access the analysed values.
But what if a variable has several dozens or several hundreds of categories? How can you assess the share of individual villages in the structure of a region or present the abundance of press vocabulary? Another challenge would be an analysis of phrases used by online store users in a search engine or the topics hotel guests write about in comments.
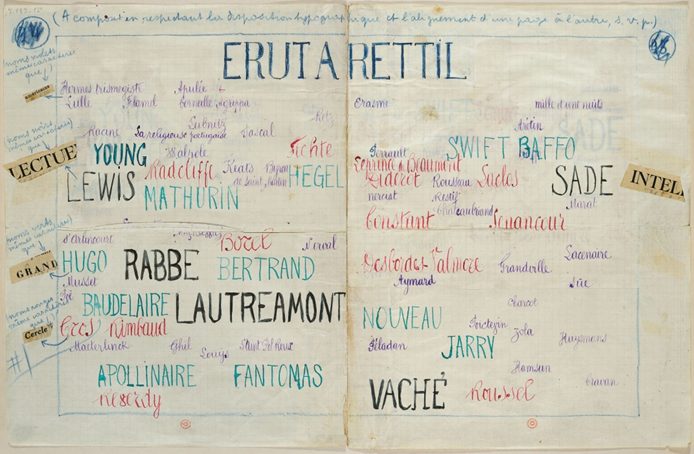
Are we forced to merge categories or use traditional plots, which are often barely legible (or even completely indecipherable)? In such cases, a very attractive technique of visual presentation of the weight of individual categories comes to the rescue: word cloud, aka tag cloud. Its traditional application is shown below.
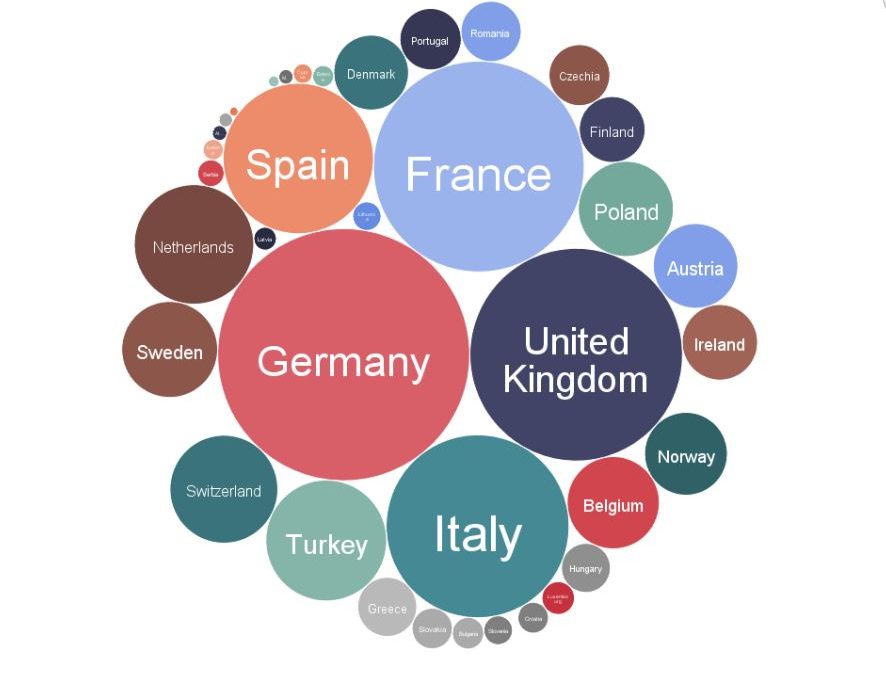
The word cloud available to PS IMAGO PRO users refers back to these classic solutions. We will discuss its possibilities now. Our analysis will be based on Eurostat data on the population size in selected European countries[1]. The thirty-seven states are too many for a table, bar chart, or pie chart but we don’t want to do only a standard TOP 10. This is where the word cloud steps in. Have a look at the visualisation below.
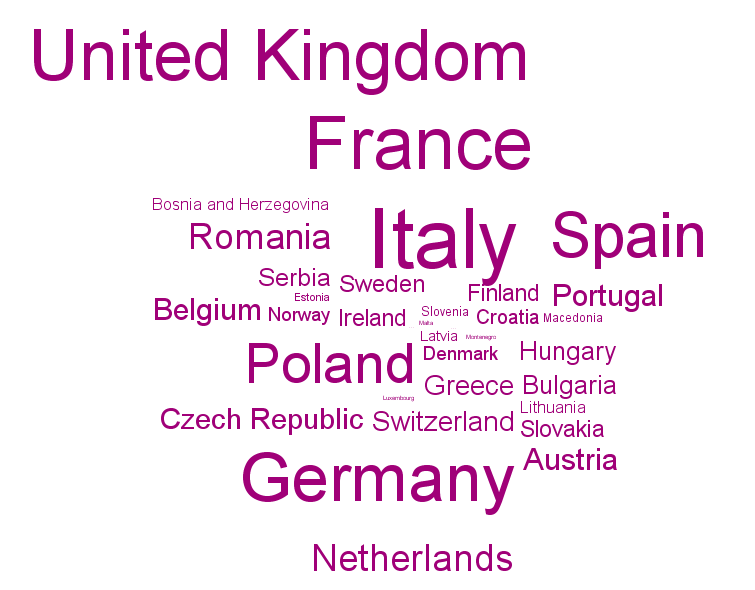
However, the word cloud has some interpretative traps, which I will illustrate using a simple example. The word cloud is used first and foremost as an attractive form of visualisation and so it is very difficult to read the size relation, in particular as the words are not to scale. An inexperienced recipient may interpret the surface area of the word instead of its height, so that longer words may appear more important. This may be resolved with abbreviated names of categories or codes. Other features that need to be taken into consideration are font and colour. It is a good idea to use only upper case or lower case, avoid fancy fonts, and use a single colour. The perception of the weight of a word may depend on the words that surround it and the distance to the centre of the cloud. The above-mentioned reservations apply to the incorrect interpretation which result from the user giving in to optical illusions, rather than flaws of the cloud itself, which remains a particularly attractive visualisation tool.
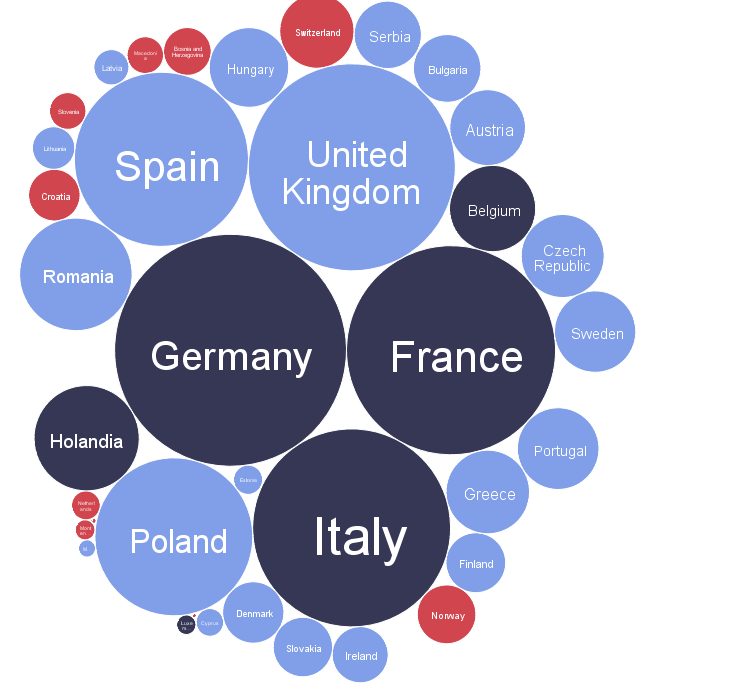
Let’s have a closer look at additional options of the word cloud algorithm in PS IMAGO PRO. We will use Eurostat data again[1. This dataset focuses on the gross domestic product in EU member states and candidate states. We will additionally use colours to distinguish EU-12, countries that joined the European Union (after 1995), and countries seeking to become members or otherwise associated with the EU.
As you can see, the word cloud is a method of an attractive visualisation of a frequency table or a table with aggregated statistics for individual categories. It works particularly well for variables with large numbers of categories. The user is not limited to the count and sum. They may use other statistics and values of any indices as well. The word cloud will without a doubt add colour to your report. It can also facilitate interesting conclusions not clearly visible in a table or a traditional plot.
[1] Source of data: Eurostat (https://ec.europa.eu/eurostat/data/database). The data includes 37 countries: European Union member states, candidate states or states that pursue membership, Norway, Iceland, and Switzerland. Bosnia and Herzegovina was excluded due to the lack of data.
Contact us, to find out more about PS IMAGO PRO!