Written by Przemyslaw Solecki (Predictive Solutions)
WHEN ANALYSING DATA ON MIGRATION, TRANSPORT, INTERNATIONAL TRADE, OR TRAFFIC ON A WEBSITE, YOU ARE OFTEN FACED WITH THE PROBLEM OF VISUALISING THE FLOW BETWEEN THE ANALYSED UNITS.
You can do this with bar charts, structural juxtaposition using cumulative charts, or sometimes using a table with appropriate gradient filling. Generally speaking, there are many ways to approach this but, in reality, most of them overlook the problem of flow visualisation. When faced with a hierarchical or multi-staged phenomenon (such as traffic on individual pages of a website, travel with a connecting flight), standard forms of visualisation fail miserably. The latest version of PS IMAGO PRO offers a solution to your flow visualisation challenges: the Sankey diagram.
The visualisation is named after Captain Matthew H. Sankey, an Irish engineer who lived at the turn of the 19th century and published this type of chart for the first time in history in his 1898 paper (M.H.Sankey, The Thermal Efficiency of Steam Engines, Minutes of Proceedings of The Institution of Civil Engineers. Vol. CXXXIV, Session 1897-98. Part IV.)
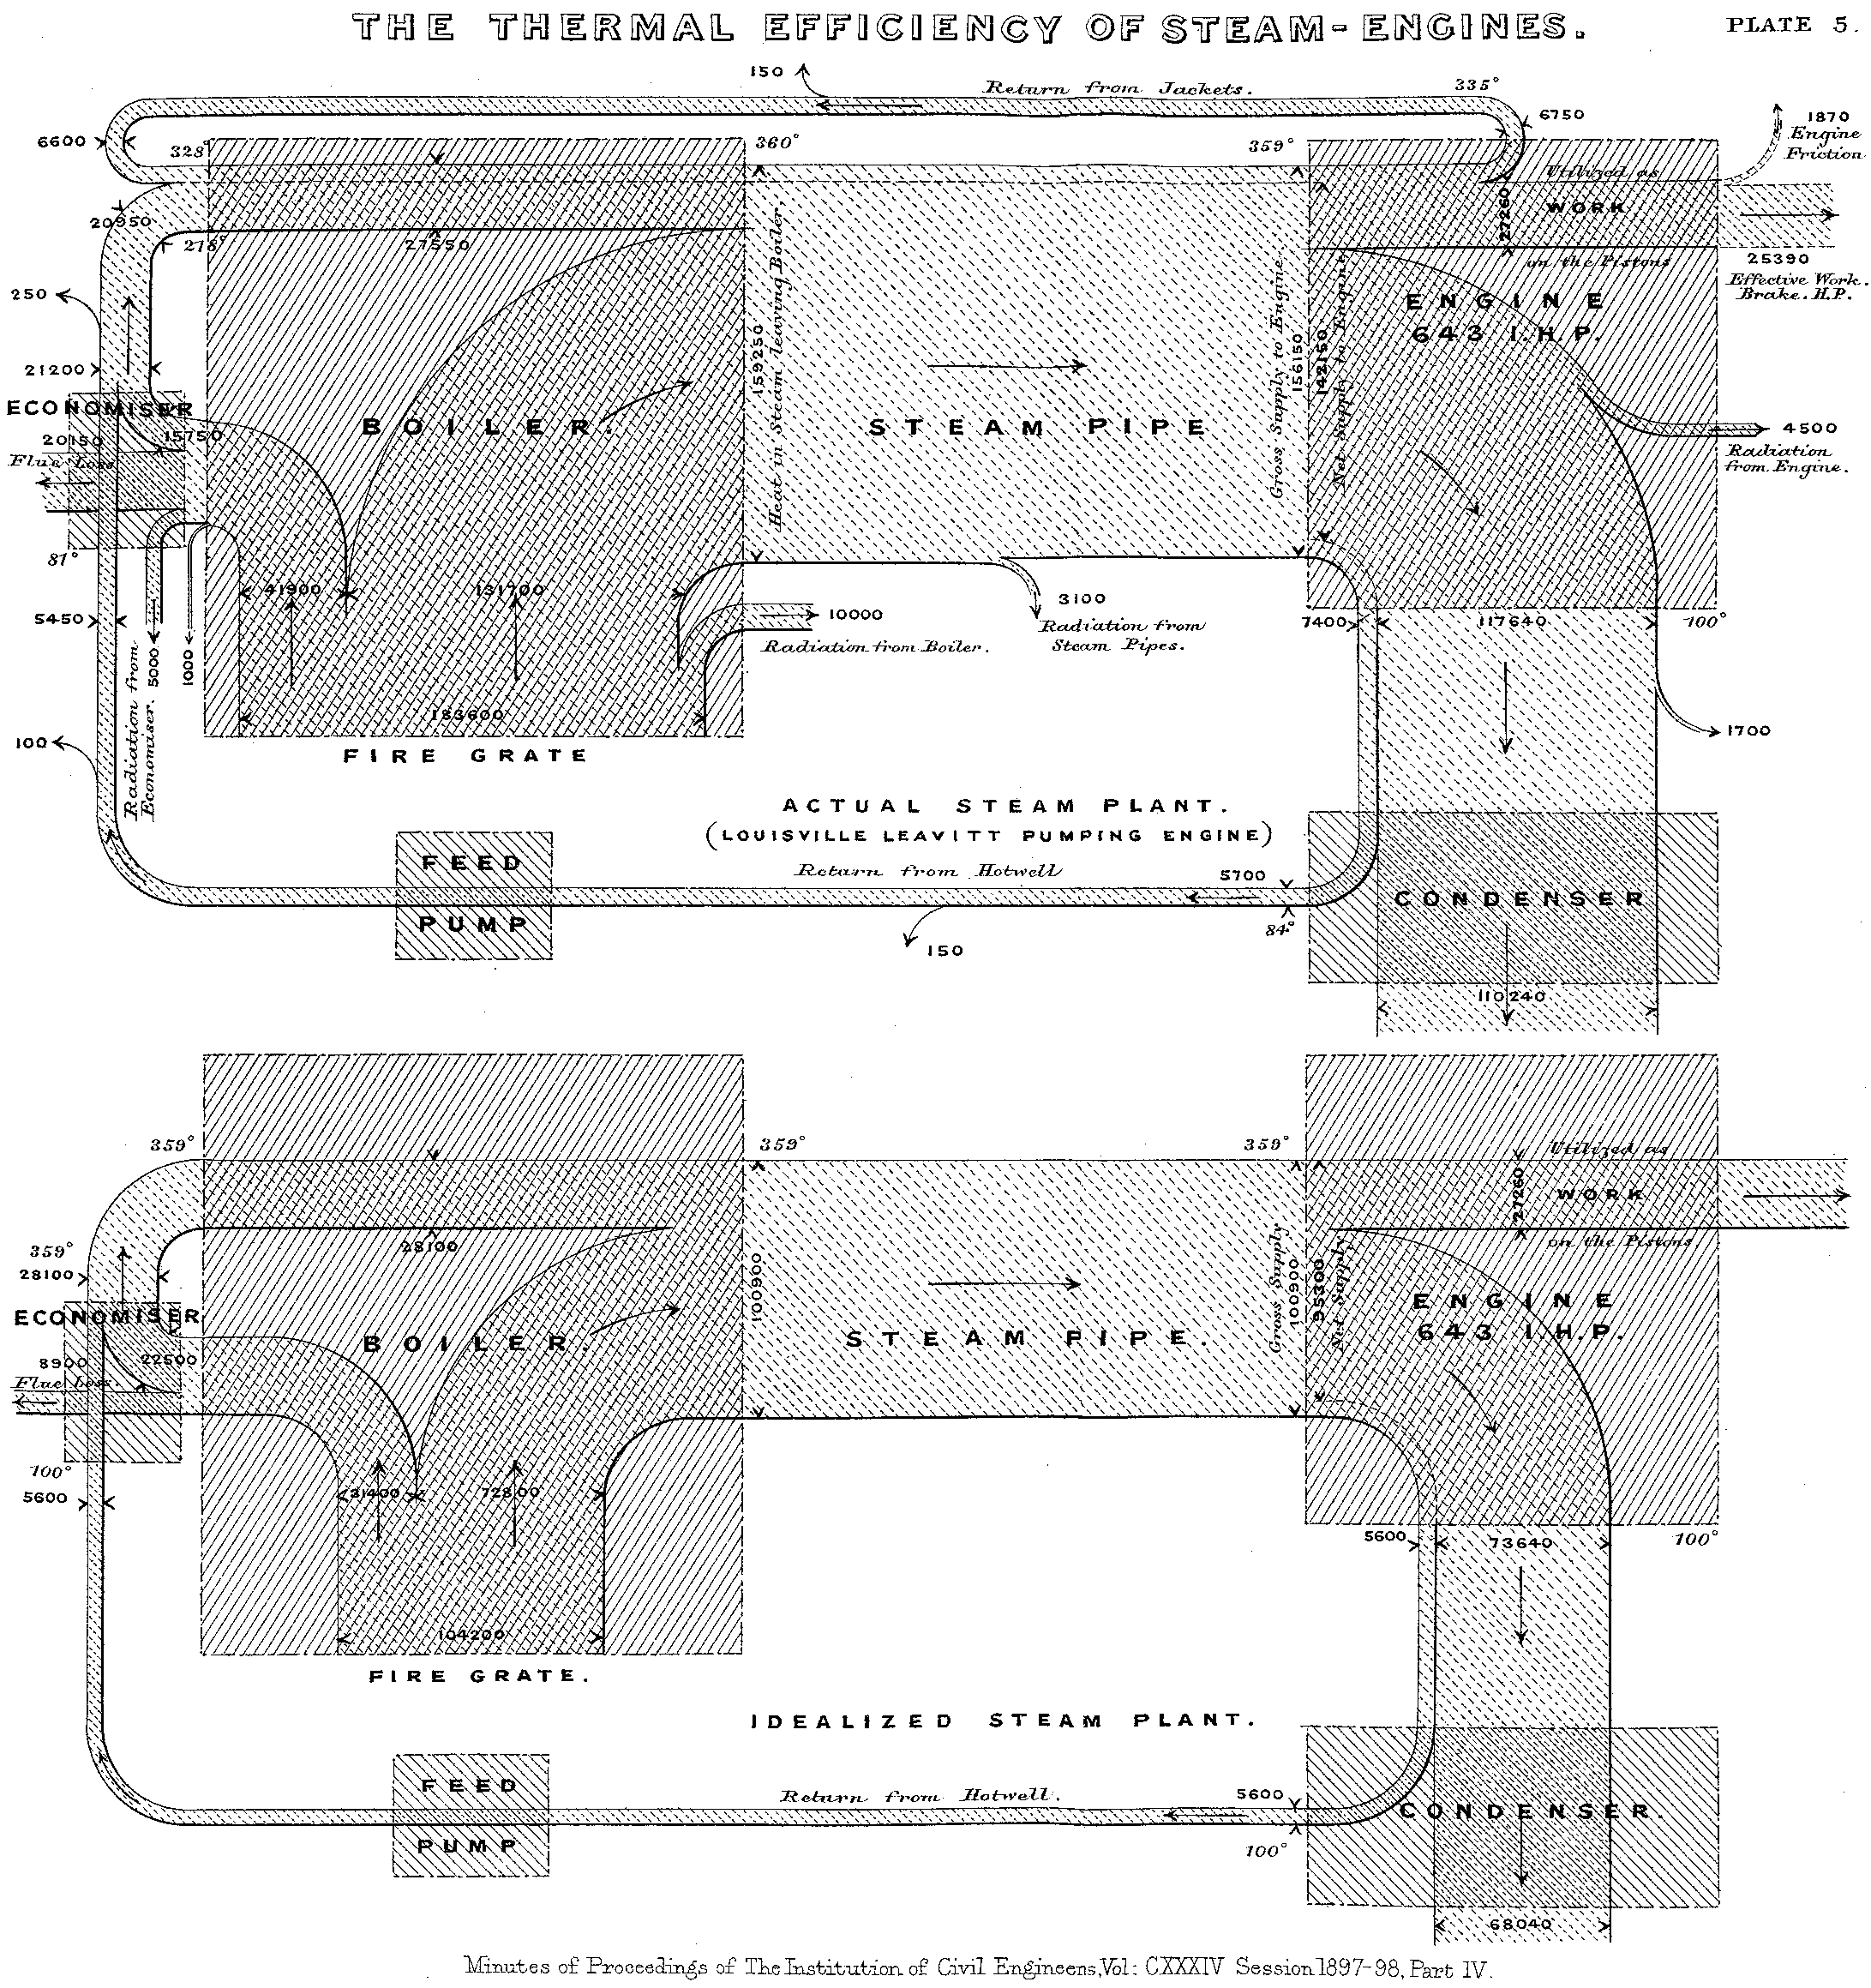
Source: Wikipedia (https://pl.wikipedia.org/wiki/Plik:JIE_Sankey_V5_Fig1.png).
The chart analyses such elements of the steam engine as the boiler, condenser, and feed pump. The heat flow is presented as a stream, where the width of the stream reflects the amount of heat processed in a unit of time.
Where can you find the Sankey diagram in PS IMAGO PRO? The visualisation is located in the Predictive Solutions menu under Charts. As was the case for the Word Cloud blog, the data for the visualisation comes from Eurostat. This time, we will analyse air traffic between selected European countries, namely France, Germany, Spain, and Italy. To improve the clarity of the visualisation, I removed domestic traffic.
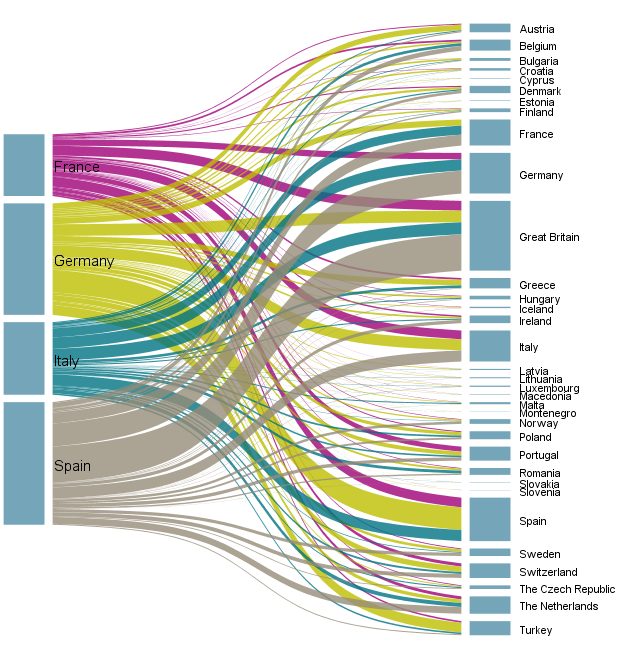
Figure 2. Passenger traffic among selected European countries in 2017
How to read the chart? Countries of departure are shown on the left-hand side and countries of destination, on the right. The thickness of lines connecting the objects on the left to the the right reflect the number of passengers who travelled between the countries. The thickness of the bars on both sides shows the total number of passengers. (NOTE, only passengers from the four selected countries are shown on the right).As you can see, travellers from Spain most often go to Great Britain, Germany, and France. Passengers from Germany travel to such countries as Austria, Turkey, or Switzerland, which attract relatively fewer passengers than from the other three analysed countries. The chart shows further that Spain provided the largest number of passengers among the four countries, and the most popular destination was Great Britain. Keep in mind that the chart does not show the nationalities of the travellers, but travel instances only. A significant part of the traffic is generated by return flights as is the case of Germany and Spain.
It is really easy to generate such a visualisation in PS IMAGO PRO. Specify the qualitative variables you want to analyse as nodes. The order of the nodes is very important. The flows are presented in the order of variables in this window. You can analyse frequencies but you can also use a quantitative variable; its summed values will be presented on the chart (this option is usually used when processing previously aggregated data). You can also select the chart colouring mode (by including the ‘from to’ variable category and taking into account statistics of the colour variable). Additional editing options are: chart layout, labelling options, colour palette, or loading a custom template. You can also modify chart colours manually.As you can see, the Sankey diagram works well for assessing the strength of relationship between qualitative variables (such as countries) or hierarchical data. The relationship may reflect both co-occurrence and other values that can be summed (such as the value of trade, number of passengers, or migration). Additional options include analysis of structurally complex tables or the assessment of flows between segments identified using other analytical methods (for example, cluster analysis). It is an easy to use and attractive visualization tool.
[1] Source of data: Eurostat (https://ec.europa.eu/eurostat/data/database). Domestic traffic has been removed from the data (country of destination = country of origin).
Contact us, to find out more about these and all other great features of PS IMAGO PRO!