By RAFAŁ WAŚKO (Predictive Solutions)
The Student’s t-test group is used to compare two groups of results, measured by the arithmetic mean, against each other.
WHAT DO THE T-TESTS TEST?
These types of tests will be useful to us when we want to determine whether the scores in one group are greater or less than in another group, and whether these differences are statistically significant. The application of t-tests is very wide. They are often used in medical, natural and social sciences, but they also have their application in business.
As an example, a group of patients with elevated cholesterol were given a new drug. Patients were measured before and after drug administration. The researcher wants to see if the results of the first cholesterol measurement are different from the second. For this purpose, we can use a pairedsample t-test to determine whether the differences are statistically significant. Another example would be a breakfast cereal manufacturer who takes a sample of packs from the production line and checks if the average weight of the samples differs from the assumed value.
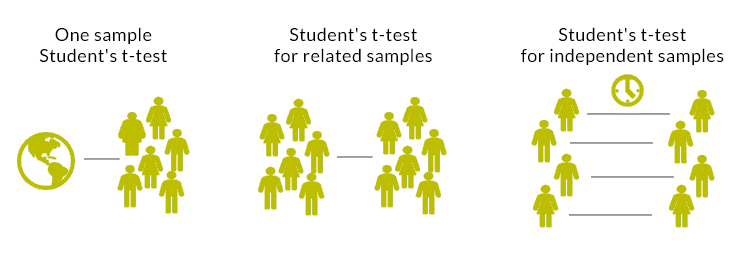
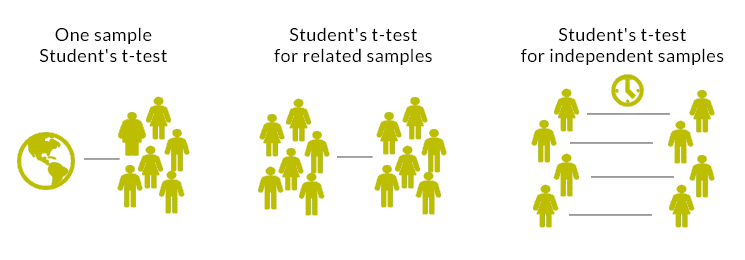
Depending on which research groups the means come from, we can distinguish 3 types of Student’s t-tests:
- One sample Student’s t-test
- Student’s t-test for related samples
- Student’s t-test for independent samples

WHEN CAN THE STUDENT’S T-TEST BE USED?
Student’s t-tests are parametric tests and certain assumptions must be met before they can be used:
- First of all, remember that we use t-tests when we want to compare only two groups of results.
- The variable under study should be a quantitative variable for which we calculate the arithmetic mean.
- In the case of the dependent variable, its distribution should be close to the normal distribution.
- In the case of the t-test for independent samples, it is required to meet the assumption of homogeneity of variance in the compared groups.
- It should also be ensured that the groups compared are of equal size.
INTERPRETATION OF THE TEST RESULT
The interpretation of the Student’s t-test results is relatively simple. Depending on the selected t-test and statistical software, we will receive information about arithmetic means, standard deviation, difference of means, t-test result, degrees of freedom and test significance level. It is most often assumed that if the significance level is less than 0.05, the differences in the means are statistically significant.
ONE SAMPLE T-TEST
This is the simplest form of the t-test, which is used to check whether the average value obtained in the study differs from the assumed value. In this case, we have only one test sample, in which we measure, and then we compare this result with, for example, a value determined on the basis of theory.
Example:
We can use the one-sample t-test to check whether the average score of class A students in the exam is statistically significantly different from the average value obtained by students from another country.
Assumptions for the one-sample t-test:
- The variable under study is measured on a quantitative scale.
- The distribution of the examined variable is close to the normal distribution.
Formula for Student’s t-test for one sample:

![]() – sample mean
– sample mean
M – theoretical mean, compared value
SD – standard deviation
T-TEST FOR DEPENDENT SAMPLES
The T-test for dependent samples is used to estimate whether the means of two related samples differ from each other. The samples are dependent because the result of the first measurement and the result of the second measurement refer to the same observations. The advantage of a repeated measure study is that it can eliminate individual differences between subjects. If the assumptions for the t-test are not met, its non-parametric counterpart, the Wilcoxon test, should be used.
Example:
A researcher is testing the effect of a new drug on lowering blood pressure. In a group of 50 patients, for each of them, blood pressure is measured before and after administration of the drug. In order to check whether the differences are statistically significant, the t-test for related samples should be performed.
Assumptions for the t-test for related samples:
- Case groups to be compared must be dependent.
- Variables are measured on a quantitative scale.
- The distributions of the variables are close to the normal distribution
Student’s t-test formula for related samples:

INDEPENDENT-SAMPLES T-TEST
This type of test is used to compare the results for two independent groups, e.g., a control group with an experimental group, a group of women and a group of men, or a group of humanities students with science students. If the difference in means is large enough, it is assumed that the two compared groups differ statistically significantly in terms of the value of the dependent variable.
The independent-samples t-test has the most assumptions to be met. One of the assumptions is the homogeneity of variance of the compared groups, however, it is worth noting that if this assumption is not met, it is possible to perform this test with an adjustment for the lack of homogeneity of variance.
The Mann-Whitney U test is the non-parametric equivalent of the independent samples t-test.
Example:
A university decided to check whether students who participated in online statistics classes had a better result in the final exam than students who participated in standard classes at the university. In such a case, we use an independent-sample t-test to verify differences.
Assumptions for the t-test for independent samples:
- The groups of cases to be compared must be independent.
- Equivalence of compared groups of observations.
- Homogeneity of variance in the studied groups.
- Variables are measured on a quantitative scale.
- The distributions in the studied groups are close to the normal distribution
Student’s t-test formula for independent samples (fulfillment of the assumption of homogeneity of variance in the analyzed groups):

BEER HISTORY OF THE STUDENT’S T TEST
To end with, we look at a curiosity of the Student’s t test. You may wonder where the term Student in the name of the test came from. Is it a student-only test and is it only used to measure student characteristics? Or is it one of the first statistical tests students learn about, hence the name? The history of this name is a bit different and it is worth to briefly present it.
The story is related to William Gosset, a chemist and mathematician by education. Gosset, was employed at the Guinness Brewery in Dublin as one of the scientists who had to ensure control and proper quality of production.
Beer is a combination of natural products, i.e., malted barley, hops, yeast and water. These natural products have inherent variability – their quality depends on a number of external factors: crop variety, but also on climatic conditions, soil conditions, etc. Gosset’s task was not only to evaluate the quality of these products, but also to carry out inspections in a cost-effective manner. This required experimenting with a small number of samples to draw conclusions that could be applied to a large-scale brewing process. Gosset found that using small samples, the distribution of the means deviated from the normal distribution. Therefore, he could not use conventional statistical methods based on the normal distribution to draw conclusions. As a result, he was able to develop a method that made it possible to effectively compare small samples.
Gosset wanted to publish the results of his work, but the Guinness privacy policy prevented it. As a result, the brewery and the scientist came to an agreement and Guinness allowed Gosset to publish his observations anonymously and without using any of the company’s records. W. Gosset followed the guidelines and published the results in 1908 in an article entitled “The Probable Error of a Mean” in the journal Biometrica under the pseudonym “Student”. As for the pseudonym itself, it is not certain where the idea for such a name came from, but it can be assumed that it came from the cover of the scientific notebook used by W. Gosset at the time.

