By Damian Zboriowski (Predictive Solutions)
THE GOAL OF COMPUTER SOFTWARE IS TO SUPPORT THE USER AT WORK. THE PS QUAESTIO PRO PLATFORM IS NO DIFFERENT.
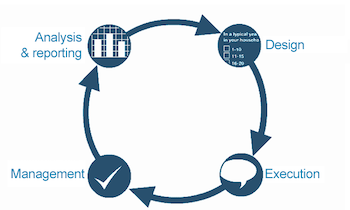
As everybody knows, the survey process consists of a few stages:
- Design
- Execution
- Management
- Analysis and reporting

Figure 1. Stages of the survey process
The possibility to use particular elements of the questionnaire at the design stage and, simultaneously, the great ease in distributing another survey among the respondents offers significant time savings and at the same time protects against the so-called “all-rounders” (namely large questionnaires, in which we ask everybody about anything). I am a strong opponent of them, as practice indicates that the preparation of several short and precisely “delivered” surveys gives much better effects. Modern software must support the researcher at each of the stages in the survey process. It is very often the case that we receive extended support in the survey, but it is missing at another key stage being the analysis of the collected data.
SURVEY DESIGN STAGE
When preparing the survey plan we have to demonstrate significant knowledge of the subject area which is its subject matter. This is one of several very important premises encouraging many institutions to, if possible, undertake independent (using internal resources) implementation of the survey process. In the end, it is the survey client that knows best the specific nature of the industry, the market situation, the research problem, or the customers – namely the areas that should always be considered when starting even a small, single survey project. Certainly, any conceptual work must be completed by the user. However, already at the stage of building the questionnaire, support from IT tools turns out to be extremely useful.

Figure 2. One survey made using many contact channels

Figure 3. The data structure along with a description is created already while building the questionnaire.
DATA QUALITY AND QUESTIONNAIRE LOGIC
Another very important element is data quality. In this regard, the “arsenal” that we have in hand in PS QUAESTIO PRO is really impressive. In the case of a wrong answer the software will not only allow filling of the questionnaire to be continued, but will also indicate where an error has been made and what type of error it is.

Figure 4. A sample system message displayed when completing the survey
At this stage let me mention two other significant elements. First, for the researcher to successfully use complex logical conditions he or she must have the graphic interface available. In this way, instead of writing code from scratch, he or she will be able to quickly “click” them. Second, it is worth practicing the building of various conditions, passages and rules – as a result, we can significantly make it easier for the respondent to fill in the questionnaire. I think I don’t have to recall that a user-friendly questionnaire is one of the vital elements supporting a high “response rate” (ratio of the invitations to the survey to the number of the completed fillings).
IMPLEMENTATION STAGE – DATA COLLECTION
The support that the software delivers is perhaps most visible at this stage. The user receives functionalities that are available only from the IT system’s level. Combining multiple channels First of all, choosing the main channel of contact with the client e.g. online, we don’t have to be restricted to this single way of reaching the respondents. At each moment in the course of the survey project, the researcher may activate another contact channel – without time-consuming preparations and without performing any additional work. For instance, if in the course of a project implemented by the CATI technique (telephone survey) the respondent declares the willingness to finish the survey project later, they can:
- continue the interview later, starting from the moment he or she stopped the earlier conversation,
- finish the interview, using the online questionnaire he or she will get authenticated access to by e-mail.
Simultaneously, all results of the survey project will flow in to a common, central database, which ensures a coherent structure to the data set and is properly secured
RESPONSIVE LOOK OF A QUAESTIONNAIRE
Even the most interesting research topic may have a low response rate if we do not ensure that its visual side is attractive. This is particularly important in the times when most respondents use mobile devices and expect the presented content to be responsive. An absolute minimum is the possibility to adjust the graphic looks of our survey to the organization’s internal standards. In this regard, PS QUAESTIO PRO offers the researcher full control over the appearance of the questionnaire. He or she receives predefined visual templates, which can be freely modified, by adding graphic elements, animations, videos, sound, etc.
SURVEY COURSE MANAGEMENT
Basically, the term project management can be summed up in one sentence, as the scope of activities allowing for current control over the survey process. This stage focuses mainly on elements related to control over the data collection process, through e.g. support for its efficiency, or responding to any upcoming events. As the framework of the article is limited, I will present the description of this stage below by referring first of all to my favorite implementation technique – CAWI. In order for management of any process to have sense and be effective, it must be based on reliable data delivered to the managing person, preferably on the current basis, online.
The earlier we have knowledge about an incident, the faster we will react to it. For instance – if a large part of the respondents stop filling in the questionnaire at the same question, it is worth verifying whether the question is understandable and, if possible, changing its content. Therefore, professional knowledge about the stage of the results collection process is extremely important for the researcher, i.e. how many respondents have completed filling in of the questionnaire. Equally important is the information how many of them have stopped the survey, or how many respondents are in the course of giving answers. One of the most interesting indicators I use is the percentage of persons returning to the survey. It measures our effectiveness in “persuading” the respondents who have earlier abandoned it to finish the questionnaire.
")
Figure 5. The online report includes information about the progress in survey implementation
Management also includes interactions with respondents intended to:
- notify the respondents about the survey project,
- encourage the respondents to participate,
- remind the respondent about the pending survey (if the respondent has not finished giving the answers)
- thank the respondents for participation, etc.
These are the activities that significantly affect the response rate (namely the number of completed questionnaires). As usual in such situations, the devil is in the detail. The mere fact of sending an e-mail inviting to participate in the survey is nothing exceptional. We receive such invitations every day. The point is to ensure that the sent letter looks the same as our paper correspondence (important especially in the case of public administration) or as the graphic layout of our website (corporate standard), etc.
In addition, the message content itself must offer the possibility of being customized. For example, knowing the respondent’s sex we include the phrase Dear Sir or Dear Madam. We can also try placing any other information that we have about the respondent – first name, last name, date of the last visit, products he or she has, etc. This makes the respondent’s trust grow, and that is important for us. If the aforementioned actions are accompanied by another very important element such as personalization of the questionnaire content, we will certainly make a good “first impression”. As everybody knows, there will be no second opportunity for the “first impression”. The use of the above functionalities is of tremendous importance for the success of the survey and is even more valuable as all of them can be handled by the researcher themselves (without learning new programming languages).
RESULTS ANALYSIS AND REPORTING STAGE
An unquestionable advantage of the survey platform which simultaneously offers advanced tools for the analysis and distribution of the results is the fact that the data collected will be analyzed and transferred to the recipients immediately after finishing the project. It is said that 80% of the time required for the analysis is consumed by the preparation of data. In this case, I can definitely say that your involvement in this stage will be close to zero. All the respondents’ answers, regardless of the multiplicity of the research techniques, or the languages used in the research project, will be in the central database. Their high quality will also be preserved. No data shortages, typographic errors, incorrect records or ranges e.g. age 150 years, no omitted questions, etc.

Figure 6. Purpose of the study: Make the right decision quickly
PERIODICAL RESULTS REPORTING
The situation where the researcher wishes to report the results of a continuously (on-going) conducted survey is more interesting. The functionalities allowing for full automation of the procedures of preparing the reports and their mass distribution within the organization become useful in this case. In such a case, results of any studies in the dashboard format are placed in a customized report, and then published on the corporate web portal.

Figure 7. Report design environment

Figure 8. Cloud version of the web portal for distribution of reports
PS QUAESTIO PRO also offers broader access to information. We can combine the results collected with any past data (coming from other systems in the organization) in this way achieving a more complete image of the respondent. In the end, the decision about sending our product offer in a letter to clients may cost tens of thousands of dollars. If the conclusions from the survey combined with any past data let us limit the risk of sending communication to clients with a low propensity to purchase, it is worth taking up such a research challenge. An equally interesting problem is customer satisfaction monitoring on the basis of NPS questionnaires. An immediate reaction to a very low assessment allows a positive relationship with the client to be maintained and, in the longer term, improves the quality of service, which I encourage you to begin already today.
PS QUAESTIO PRO
PS QUAESTIO PRO is a complete environment for the implementation of questionnaire surveys allowing for full integration with the IT infrastructure and exchange of information with other systems operating within the organization. The system supports all survey stages from creation of questionnaires to data collection using such techniques as CAWI, MOBI, CATI and CAPI. It offers basic and advanced data analysis (using SPSS technologies), and preparation of an analytical report in the form of a dashboard or document, and its distribution across the entire organization. The PS QUAESTIO PRO platform may be used, among others, as follows:
- in questionnaire surveys;
- in supporting process evaluation procedures;
- in order to streamline survey results reporting
- in advanced data analysis.
For more information see PS QUAESTIO PRO .