PS IMAGO PRO Designer
With the result objects of analyses created with SPSS Statistics, the creator of the report will finally be able to prepare information customized to the recipient’s needs. Some definable elements of the report are: Layout, Structure and Navigation, Style, Appearance, Format, and Object Descriptions and Comments. You can create the report according to your company standard. The ready report can be published on the company’s website or portal, or simply sent as a PDF to selected people, depending on the form you have chosen.
Creation of professional analysis reports
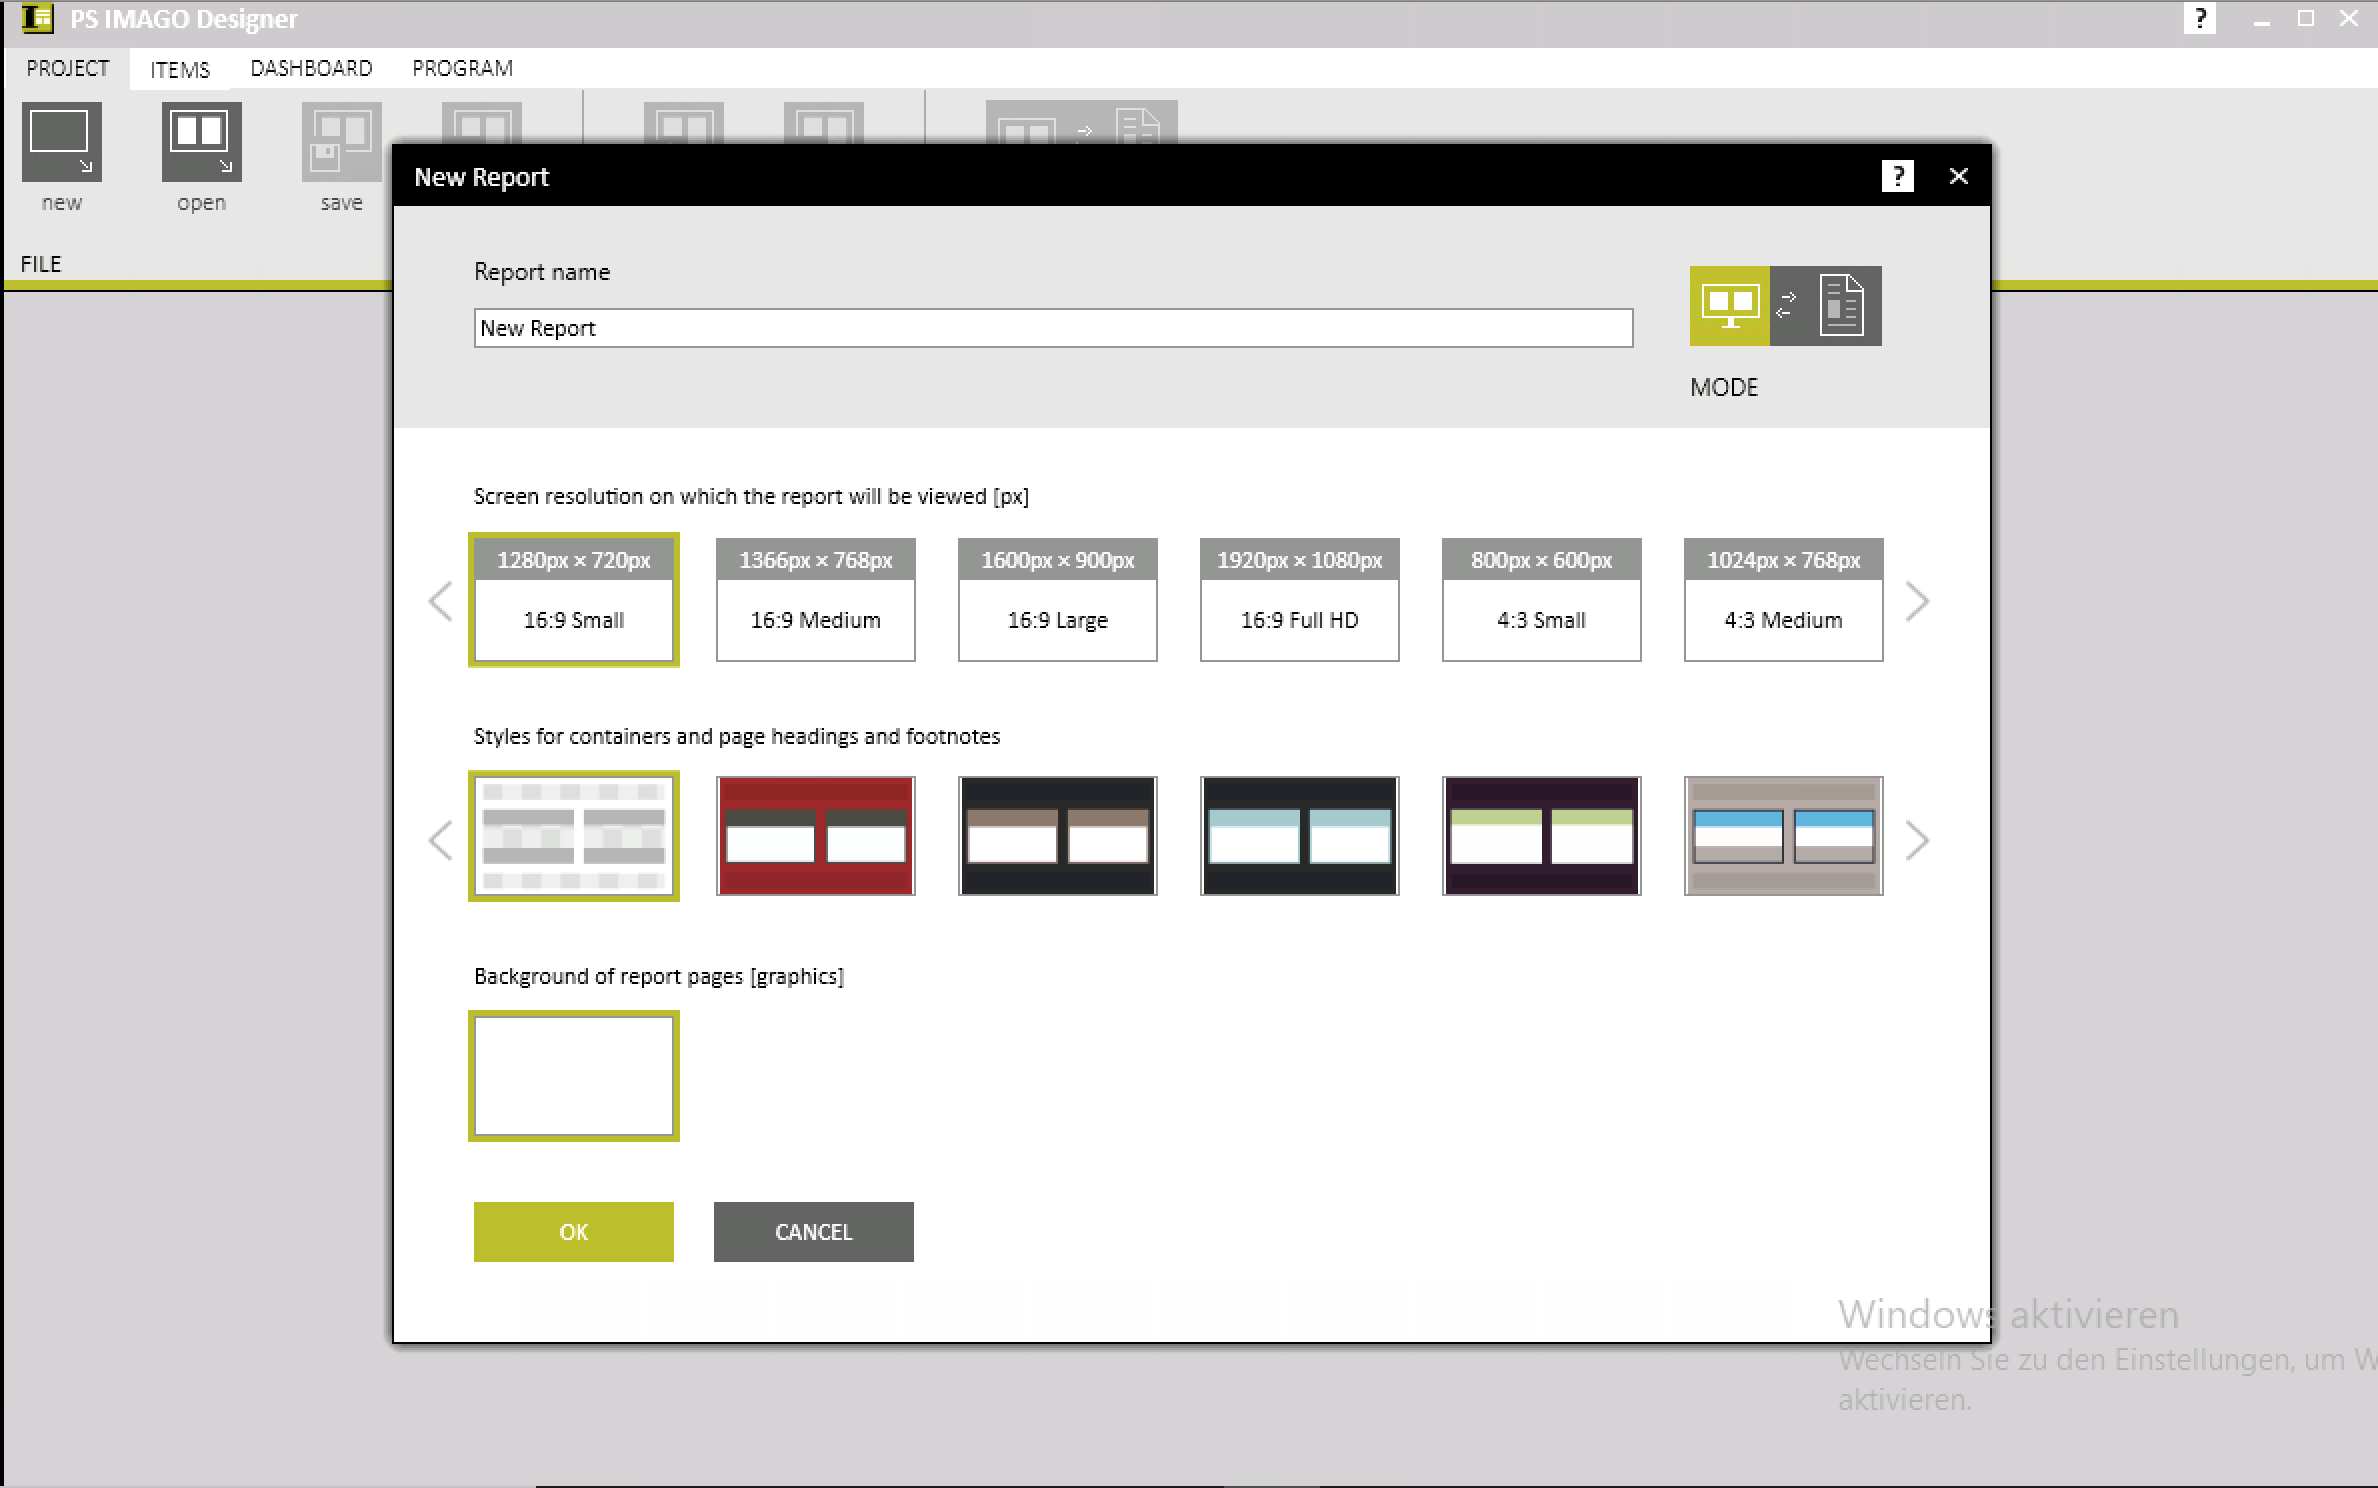
PS IMAGO Designer creates powerful reports tailored to the viewer’s visual preferences by using custom styles and backgrounds as well as strategic arrangement of result objects (tables, charts, graphs) in the report. Once created, the report structure can be reused unchanged or used as a basis for other documents and reports.
Dashboard document work mode
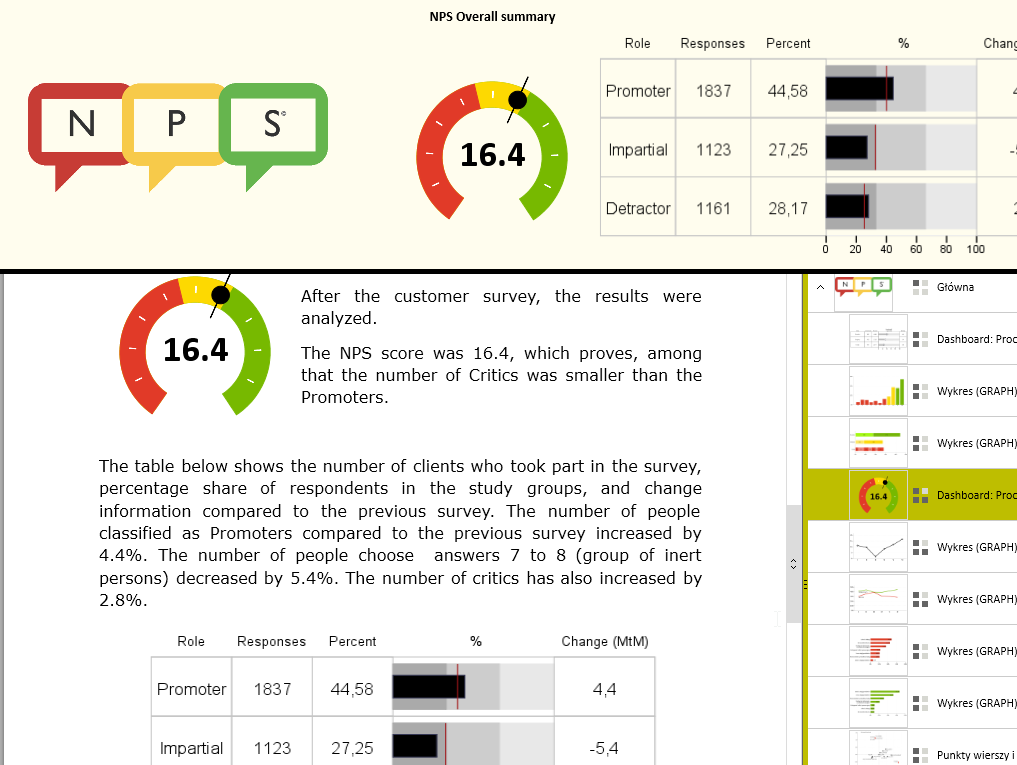
Reports created in the form of a dashboard are a proven method of communicating information essential to a company’s board of directors in a synthetic manner. However, sometimes an analyst needs to create an additional, more detailed report that contains deeper insights. PS IMAGO Designer allows the simultaneous creation of a document that can contain the same elements as the dashboard, but supplemented with more detailed analysis. Result objects, comments and conclusions used in the creation of the dashboard can be automatically added to the document report, which significantly speeds up the entire reporting process. The user can easily switch between dashboard and document mode, so both report formats can be developed simultaneously without having to switch between different applications.
Distribution of reports to the viewer
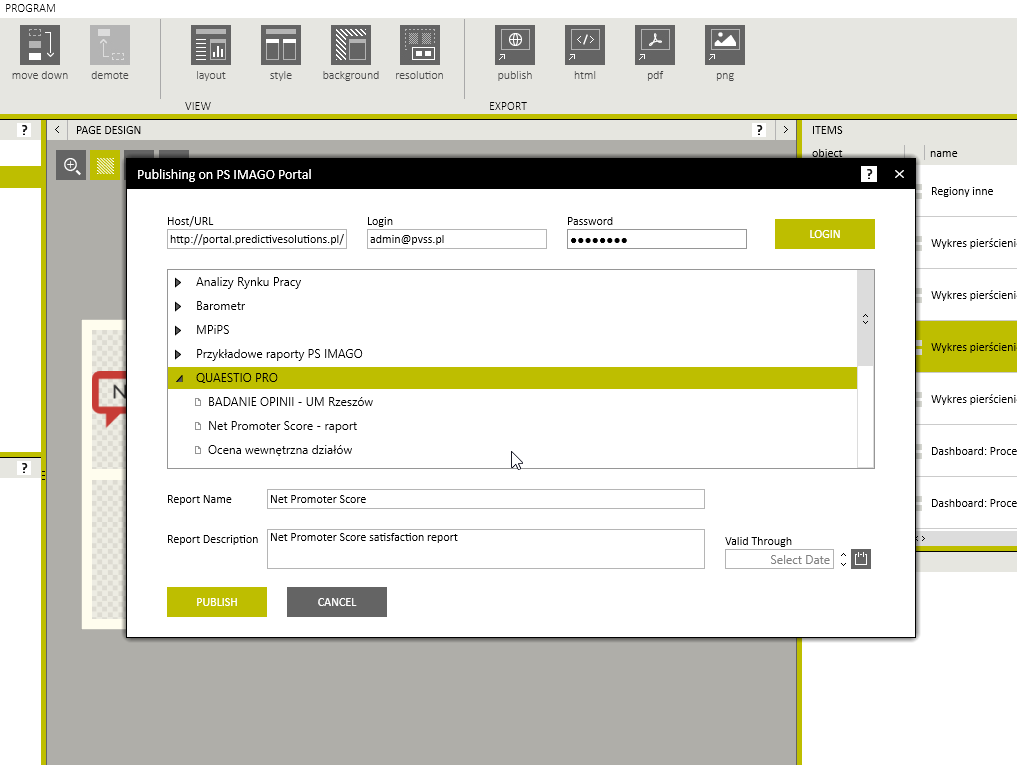
The final report can be easily saved in one of the common file formats such as PDF, docx or HTML and then distributed to several recipients e.g. as an e-mail attachment. It is also possible to publish the report via a special online platform – PS IMAGO Portal. PS IMAGO Portal has an intuitive content update mechanism that allows the report viewer to access the latest version of the report at any time via a normal web browser.
Editing analytical objects at the report level
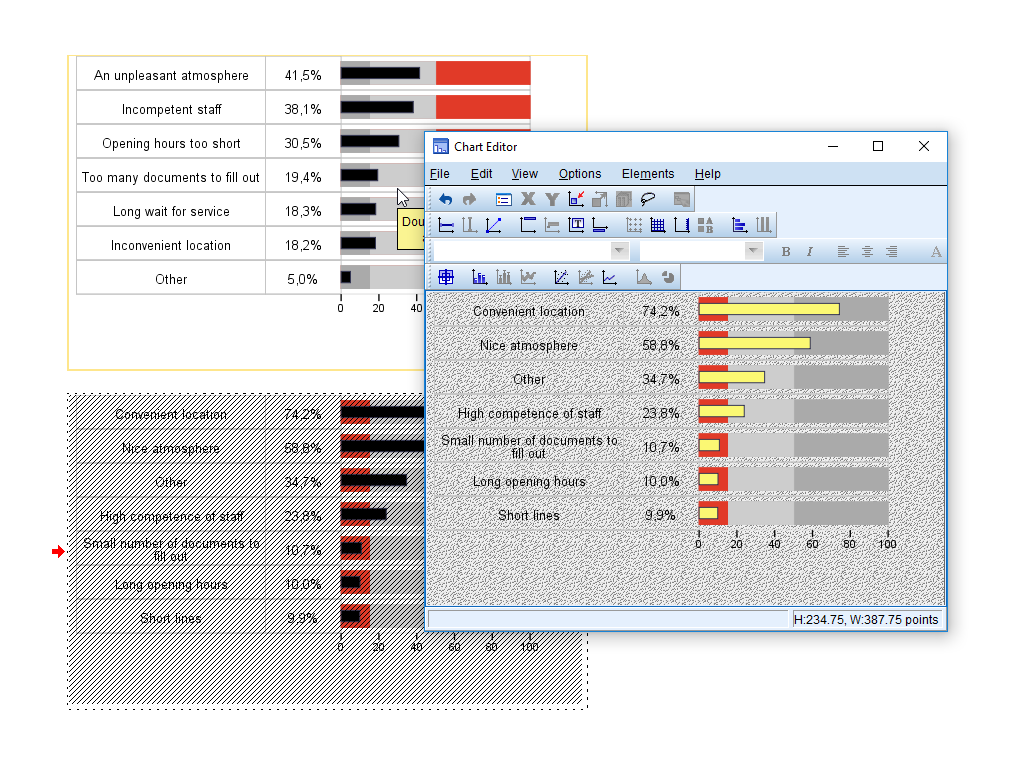
Analytical objects included in the report can be edited even if the author does not have access to the underlying database and/or analysis tool used to create the result object. If only the report is available, the author can make changes to the chart coloring, edit category labels, or change the table layout. All this is possible at the report design level without having to regenerate the object.
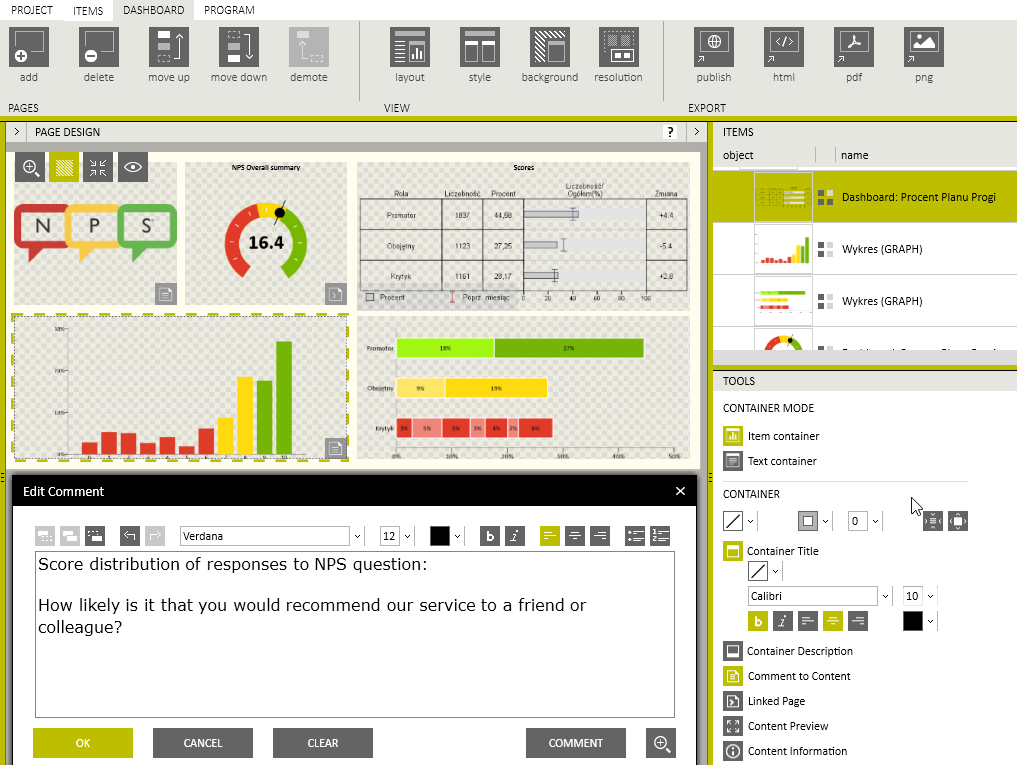
Advanced interaction with analytical objects and report pages
During the report design phase, PS IMAGO Designer provides many ways to interact with report objects: Users can add comments and titles to specific result elements; descriptions of report containers and objects can be added; links to sub-pages with more details can be embedded. In this way, users can intuitively create advanced analysis reports tailored to the needs of the most demanding reader.
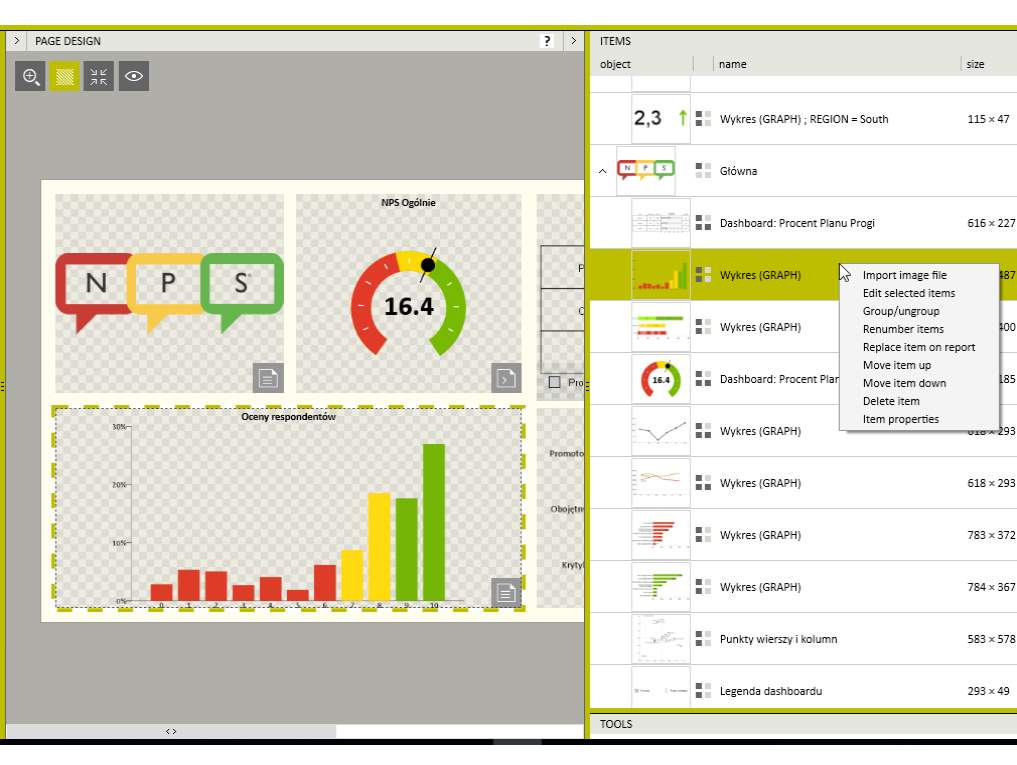
Management of analytical reports
For large reports containing many analytical objects, the user can create groups of objects, classify them, add comments, replace objects in a report, or quickly preview the contents of an object and make changes to it. This makes it possible – even for beginners – to manage analytical objects and easily create multi-level reports with many elements.