By RAFAŁ WAŚKO (Predictive Solutions)
The three-sigma rule is an important tool in statistics and quality management. In the context of data analysis, it allows the identification of outlier points that are significantly different from the rest of the data. The use of the three sigma rule in quality control also reveals anomalies, allowing early detection of problems and effective response to them, which can help avoid further complications.
WHAT IS SIGMA?
To begin with, it is worth explaining what “sigma” is in statistics. In statistics, the Greek letter “σ” (sigma) is used as a designation for standard deviation. It is a measure of the dispersion of data around the mean. In simple terms, it defines how much the values in a variable differ from the mean value. The greater the value of the standard deviation, the greater the variability in the data. In practice, the standard deviation is an extremely important measure because it allows us to assess how much variation there typically is between individual observation values and the mean. This allows us to determine whether the data is close to the mean (smaller standard deviation) or has greater variation around the mean (larger standard deviation).ASSUMPTIONS OF THE THREE SIGMA RULE
Before we get to the assumptions, it is worth briefly explaining what a normal distribution is. The history of the three sigma rule begins with work on the normal distribution. This distribution describes the characteristic properties of many natural phenomena, such as physical measurements, test results and many others. The normal distribution is bell-shaped, and most data cluster around a mean value, with decreasing frequency of deviation from the mean.
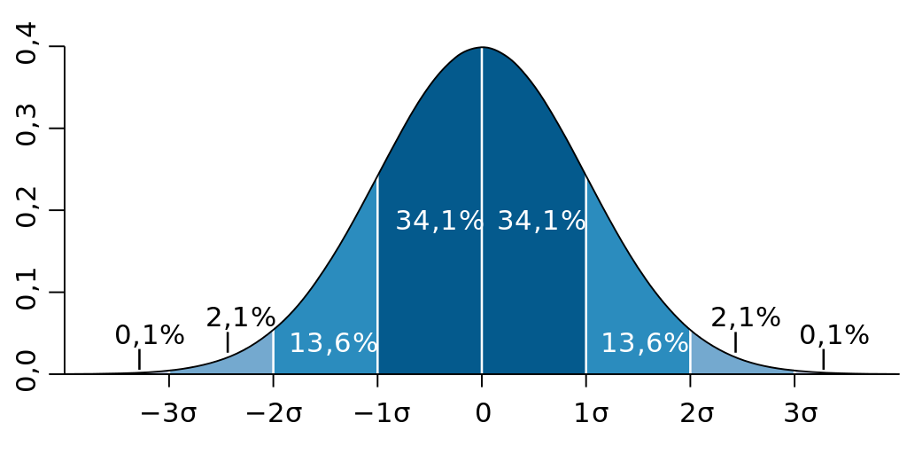
The three sigma rule is based on the assumption that for a normal distribution:
- About 68.27% of observations are within one standard deviation (σ) of the mean (μ).
- About 95.45% of observations are within two standard deviations of the mean.
- About 99.73% of observations are within three standard deviations of the mean.

Figure 1. Normal distribution with individual intervals of one standard deviation wide Source: https://en.wikipedia.org/wiki/Standard_deviation
APPLICATION OF THE THREE-SIGMA RULE
The rule presented in this text can be applied in a variety of fields, such as manufacturing, finance, medicine or social sciences. In manufacturing quality control, it can often be used to monitor production processes and identify potential problems or deviations from the norm. If the data exceeds three sigma from the mean, it can indicate problems in the production process. A second, exemplary area of application is the medical field. In medical data analysis, the three-sigma rule can help identify cases or patient outcomes that differ from the average and may require special attention. Another area could be social research, where the three-sigma rule can be used to identify non-standard behavior or events that may require further analysis.USING THE THREE-SIGMA RULE IN QUALITY CONTROL AND CONTROL CHARTS
In the early 20th century, Walter A. Shewhart, one of the pioneers in the field of production management processes, began to use statistical methods for quality control in production processes. W. A. Shewhart was one of the creators of control charts, which make it possible to monitor production processes and detect deviations from the standard.
One of W. A. Shewhart’s key achievements was the application of the three sigma rule in quality control. He introduced the concept of control limits, which were multiples of the standard deviation and were used to determine when a process showed irregularities. In control charts, the three-sigma rule is used to monitor the stability of a process and keep it within acceptable variability. Control limits based on this rule define the range within which the process should operate. Points outside the three-sigma boundaries can indicate potential deviations from the norm, requiring further analysis or corrective action.
Analysis of control charts using the three-sigma rule can proceed as follows:
- Inside 1σ: if most points are within +/-1σ of the mean, the process is stable and controlled,
- Between 1σ and 2σ: if some points are between +/-1σ and +/-2σ, the process can still be controlled, but the variability may be slightly higher,
- Between 2σ and 3σ: if the points are between +/-2σ and +/-3σ, the process may require some analysis, but may be acceptable,
- Beyond 3σ: if the points go beyond +/-3σ, it may indicate a serious deviation from the norm and the need for corrective action in the process.

Figure 2. An example of a control chart prepared in PS IMAGO PRO. UCL and LCL are values that delineate the empirical 3-sigma area above and below the average measurement value